Siemens 2005 Annual Report Download - page 100
Download and view the complete annual report
Please find page 100 of the 2005 Siemens annual report below. You can navigate through the pages in the report by either clicking on the pages listed below, or by using the keyword search tool below to find specific information within the annual report.-
 1
1 -
2
-
3
-
4
-
5
-
6
-
7
-
8
-
9
-
10
-
11
-
12
-
13
-
14
-
15
-
16
-
17
-
18
-
19
-
20
-
21
-
22
-
23
-
24
-
25
-
26
-
27
-
28
-
29
-
30
-
31
-
32
-
33
-
34
-
35
-
36
-
37
-
38
-
39
-
40
-
41
-
42
-
43
-
44
-
45
-
46
-
47
-
48
-
49
-
50
-
51
-
52
-
53
-
54
-
55
-
56
-
57
-
58
-
59
-
60
-
61
-
62
-
63
-
64
-
65
-
66
-
67
-
68
-
69
-
70
-
71
-
72
-
73
-
74
-
75
-
76
-
77
-
78
-
79
-
80
-
81
-
82
-
83
-
84
-
85
-
86
-
87
-
88
-
89
-
 90
90 -
 91
91 -
 92
92 -
 93
93 -
 94
94 -
 95
95 -
 96
96 -
 97
97 -
 98
98 -
 99
99 -
 100
100 -
 101
101 -
 102
102 -
 103
103 -
 104
104 -
 105
105 -
 106
106 -
 107
107 -
 108
108 -
 109
109 -
 110
110 -
111
-
112
-
113
-
114
-
115
-
116
-
117
-
118
-
119
-
120
-
121
-
122
-
123
-
124
-
125
-
126
-
127
-
128
-
129
-
130
-
131
-
132
-
133
-
134
-
135
-
136
-
137
-
138
-
139
-
140
-
141
-
142
-
143
-
144
-
145
-
146
-
147
-
148
-
149
-
150
-
151
-
152
-
153
-
154
-
155
-
156
-
157
-
158
-
159
-
160
-
161
-
162
-
163
-
164
-
165
-
166
-
167
-
168
-
169
-
170
-
171
-
172
-
173
-
174
-
175
-
176
-
177
-
178
-
179
-
180
-
181
-
182
-
183
-
184
-
185
-
186
-
187
-
188
-
189
-
190
-
191
-
192
-
193
-
194
-
195
-
196
-
197
-
198
-
199
-
200
-
201
-
202
-
203
-
204
-
205
-
206
-
207
-
208
-
209
-
210
-
211
-
212
-
213
-
214
-
215
-
216
-
217
-
218
-
219
-
220
-
221
-
222
-
223
-
224
-
225
-
226
-
227
-
228
-
229
-
230
-
231
-
232
 |
 |

100
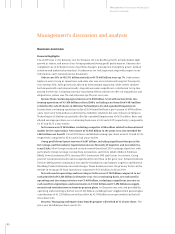
Logistics and Assembly Systems (L&A)
Following an intensive analysis by the Managing Board, the Company announced in the
fourth quarter of fiscal 2005, the carve-out of the Distribution and Industry Logistics, as well as of
the Materials Handling Products divisions of L&A into a separate legal entity, named Dematic.
These activities have been retroactively reported in Other Operations for the periods presented.
As a result, the Managing Board decided to dissolve L&A effective with the beginning of fiscal
2006. As a consequence, the Airport Logistics division and Postal Automation division were trans-
ferred to I&S and the Electronics Assembly Systems division was transferred to A&D.
Group profit of €69 million in fiscal 2005 was up 53% from €45 million a year earlier, on
Group-wide earnings improvements. While Electronics Assembly Systems was profitable in fiscal
2004, Postal Automation and Airport Logistics posted losses, including charges related to excess
capacity and project cost overruns. Sales rose 4% to €1.472 billion, including growing revenues in
the Airport Logistics division. Orders climbed 12%, to €2.015 billion, driven by a major order in
the Postal Automation division.
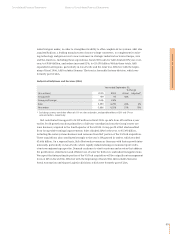
Siemens Building Technologies (SBT)
SBT posted €181 million in Group profit in fiscal 2005, a 68% improvement built on greater
capacity utilization. In fiscal 2005, all divisions at SBT contributed improved earnings and Group
profit rose in all four quarters compared to the corresponding period a year earlier. Sales and
orders both rose 4%, to €4.415 billion and €4.518 billion, respectively, particularly including
growth in the Security Systems division.
Management’s discussion and analysis
Segment information analysis
Year ended September 30,
% Change
(€ in millions) 2005 2004 Actual Adjusted*
Group profit 69 45 53%
Group profit margin 4.7% 3.2%
Sales 1,472 1,419 4% 8%
New orders 2,015 1,799 12% 16%
* Excluding currency translation effects of (1)% on sales and orders, and portfolio effects of (3)% on sales and orders.
Year ended September 30,
% Change
(€ in millions) 2005 2004 Actual Adjusted*
Group profit 181 108 68%
Group profit margin 4.1% 2.5%
Sales 4,415 4,247 4% 3%
New orders 4,518 4,358 4% 4%
* Excluding currency translation effects of (1)% on sales and orders, and portfolio effects of 2% and 1% on sales
and orders, respectively.