Siemens 2005 Annual Report Download - page 99
Download and view the complete annual report
Please find page 99 of the 2005 Siemens annual report below. You can navigate through the pages in the report by either clicking on the pages listed below, or by using the keyword search tool below to find specific information within the annual report.-
 1
1 -
2
-
3
-
4
-
5
-
6
-
7
-
8
-
9
-
10
-
11
-
12
-
13
-
14
-
15
-
16
-
17
-
18
-
19
-
20
-
21
-
22
-
23
-
24
-
25
-
26
-
27
-
28
-
29
-
30
-
31
-
32
-
33
-
34
-
35
-
36
-
37
-
38
-
39
-
40
-
41
-
42
-
43
-
44
-
45
-
46
-
47
-
48
-
49
-
50
-
51
-
52
-
53
-
54
-
55
-
56
-
57
-
58
-
59
-
60
-
61
-
62
-
63
-
64
-
65
-
66
-
67
-
68
-
69
-
70
-
71
-
72
-
73
-
74
-
75
-
76
-
77
-
78
-
79
-
80
-
81
-
82
-
83
-
84
-
85
-
86
-
87
-
88
-
 89
89 -
 90
90 -
 91
91 -
 92
92 -
 93
93 -
 94
94 -
 95
95 -
 96
96 -
 97
97 -
 98
98 -
 99
99 -
 100
100 -
 101
101 -
 102
102 -
 103
103 -
 104
104 -
 105
105 -
 106
106 -
 107
107 -
 108
108 -
 109
109 -
110
-
111
-
112
-
113
-
114
-
115
-
116
-
117
-
118
-
119
-
120
-
121
-
122
-
123
-
124
-
125
-
126
-
127
-
128
-
129
-
130
-
131
-
132
-
133
-
134
-
135
-
136
-
137
-
138
-
139
-
140
-
141
-
142
-
143
-
144
-
145
-
146
-
147
-
148
-
149
-
150
-
151
-
152
-
153
-
154
-
155
-
156
-
157
-
158
-
159
-
160
-
161
-
162
-
163
-
164
-
165
-
166
-
167
-
168
-
169
-
170
-
171
-
172
-
173
-
174
-
175
-
176
-
177
-
178
-
179
-
180
-
181
-
182
-
183
-
184
-
185
-
186
-
187
-
188
-
189
-
190
-
191
-
192
-
193
-
194
-
195
-
196
-
197
-
198
-
199
-
200
-
201
-
202
-
203
-
204
-
205
-
206
-
207
-
208
-
209
-
210
-
211
-
212
-
213
-
214
-
215
-
216
-
217
-
218
-
219
-
220
-
221
-
222
-
223
-
224
-
225
-
226
-
227
-
228
-
229
-
230
-
231
-
232
 |
 |

99
industrial gear maker, in order to strengthen its ability to offer complete drive systems. A&D also
acquired Robicon, a leading manufacturer of motor voltage converters, to complement its exist-
ing technology and gain access to new customers in strategic industrial sectors in Europe, Asia
and the Americas. Including these acquisitions, fiscal 2005 sales for A&D climbed 11% year-over-
year, to €9.844 billion, and orders increased 13%, to €10.190 billion. Within these totals, A&D
expanded in all regions, particularly in Asia-Pacific and the Americas. Effective with the begin-
ning of fiscal 2006, A&D includes Siemens’ Electronics Assembly Systems division, which was
formerly part of L&A.
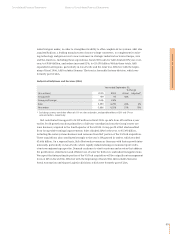
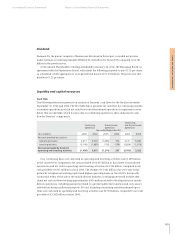
Industrial Solutions and Services (I&S)
I&S contributed Group profit of €139 million in fiscal 2005, up 46% from €95 million a year
earlier. Profit growth was due primarily to a full-year contribution from the Group’s water sys-
tems business, acquired in the fourth quarter of fiscal 2004. Group profit at I&S also benefited
from Group-wide earnings improvements. Sales climbed 26% for the year, to €5.390 billion,
including the water systems business and revenues from I&S’ portion of the VA Tech acquisition.
These acquisitions also contributed strongly to the year’s 31% growth in orders, which reached
€5.686 billion. On a regional basis, I&S offset weak revenues in Germany with faster growth inter-
nationally, particularly in Asia-Pacific, where rapidly industrializing economies require infra-
structure engineering expertise. Demand continues to rise for systems and services that address
the purification, distribution and efficient use of water for both civic and industrial applications.
We expect that integrating its portion of the VA Tech acquisition will be a significant management
focus at I&S in fiscal 2006. Effective with the beginning of fiscal 2006, I&S includes Siemens’
Postal Automation and Airport Logistics divisions, which were formerly part of L&A.
Management’s discussion and analysis
Consolidated Financial Statements Notes to Consolidated Financial Statements
Year ended September 30,
% Change
(€ in millions) 2005 2004 Actual Adjusted*
Group profit 139 95 46%
Group profit margin 2.6% 2.2%
Sales 5,390 4,290 26% 6%
New orders 5,686 4,356 31% 15%
* Excluding currency translation effects of (1)% on sales and orders, and portfolio effects of 21% and 17% on
sales and orders, respectively.