Siemens 2005 Annual Report Download - page 110
Download and view the complete annual report
Please find page 110 of the 2005 Siemens annual report below. You can navigate through the pages in the report by either clicking on the pages listed below, or by using the keyword search tool below to find specific information within the annual report.-
 1
1 -
2
-
3
-
4
-
5
-
6
-
7
-
8
-
9
-
10
-
11
-
12
-
13
-
14
-
15
-
16
-
17
-
18
-
19
-
20
-
21
-
22
-
23
-
24
-
25
-
26
-
27
-
28
-
29
-
30
-
31
-
32
-
33
-
34
-
35
-
36
-
37
-
38
-
39
-
40
-
41
-
42
-
43
-
44
-
45
-
46
-
47
-
48
-
49
-
50
-
51
-
52
-
53
-
54
-
55
-
56
-
57
-
58
-
59
-
60
-
61
-
62
-
63
-
64
-
65
-
66
-
67
-
68
-
69
-
70
-
71
-
72
-
73
-
74
-
75
-
76
-
77
-
78
-
79
-
80
-
81
-
82
-
83
-
84
-
85
-
86
-
87
-
88
-
89
-
90
-
91
-
92
-
93
-
94
-
95
-
96
-
97
-
98
-
99
-
 100
100 -
 101
101 -
 102
102 -
 103
103 -
 104
104 -
 105
105 -
 106
106 -
 107
107 -
 108
108 -
 109
109 -
 110
110 -
 111
111 -
 112
112 -
 113
113 -
 114
114 -
 115
115 -
 116
116 -
 117
117 -
 118
118 -
 119
119 -
 120
120 -
121
-
122
-
123
-
124
-
125
-
126
-
127
-
128
-
129
-
130
-
131
-
132
-
133
-
134
-
135
-
136
-
137
-
138
-
139
-
140
-
141
-
142
-
143
-
144
-
145
-
146
-
147
-
148
-
149
-
150
-
151
-
152
-
153
-
154
-
155
-
156
-
157
-
158
-
159
-
160
-
161
-
162
-
163
-
164
-
165
-
166
-
167
-
168
-
169
-
170
-
171
-
172
-
173
-
174
-
175
-
176
-
177
-
178
-
179
-
180
-
181
-
182
-
183
-
184
-
185
-
186
-
187
-
188
-
189
-
190
-
191
-
192
-
193
-
194
-
195
-
196
-
197
-
198
-
199
-
200
-
201
-
202
-
203
-
204
-
205
-
206
-
207
-
208
-
209
-
210
-
211
-
212
-
213
-
214
-
215
-
216
-
217
-
218
-
219
-
220
-
221
-
222
-
223
-
224
-
225
-
226
-
227
-
228
-
229
-
230
-
231
-
232
 |
 |

110
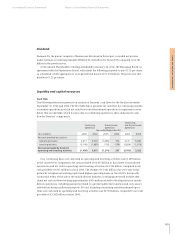
Operations provided net cash from operating activities of €3.565 billion in fiscal 2005, close to
the level of €3.635 billion a year earlier. Within Operations, net inventories increased across most
of the Groups in both the current and prior periods. PG, TS and PTD led the increase in fiscal 2005
while the rise a year earlier was driven by Com and TS. The increase at PG and PTD, as well as Com
in fiscal 2004, was attributable to order growth. Higher inventories at TS in the prior year were
primarily due to the use of advance project payments not being replenished with current pay-
ments from orders. Both the current and prior-year period included significant supplemental
cash contributions to Siemens’ pension plans of €1.496 billion and €1.255 billion, respectively.
Corporate Treasury and Financing and Real Estate activities also contributed a significant portion
of the difference between the periods under review. The change year-over-year primarily involves
reduced effects from hedging of intracompany financing, due to increased use of externally
raised financing in local currencies, while the prior-year period included repayment of a €247
million vendor note related to the earlier disposal of various businesses. For Siemens, net cash
provided by operating activities from continuing operations in fiscal 2005 was €4.217 billion,
compared to net cash provided of €4.704 billion a year earlier.
Operations used net cash in investing activities from continuing operations of €4.787 billion
in the current period compared to net cash used of €1.394 billion a year earlier. The major factor
in the change year-over-year was a significant increase in outflows for acquisitions and invest-
ments, to €3.000 billion. Major acquisitions and investments included the following: VA Tech,
whose activities were allocated primarily to PTD and I&S, for a total of €514 million, net of €535
million cash acquired; CTI at Med for €734 million, net of €60 million cash acquired; Flender and
Robicon at A&D, and Bonus at PG, in total for approximately €1.2 billion. Fiscal 2004 included
€822 million in cash used for the USFilter acquisition at I&S. Also contributing to the total change
was €1.794 billion in net proceeds from the sale of Infineon shares in the prior year, while the cur-
rent period includes €263 million from Com’s sale of a portion of its shares in Juniper. To support
business growth, capital expenditures in Operations increased year-over-year and SFS had higher
cash outflows for investing activities primarily due to a build-up of leasing assets. For Siemens,
net cash used in investing activities from continuing operations in fiscal 2005 was €5.706 billion,
compared to net cash used of €1.689 billion a year earlier.
Net cash used in financing activities for Siemens in fiscal 2005 was €1.403 billion compared
to €3.108 billion in fiscal 2004. Both periods included cash outflows for notes exchangeable into
Infineon shares which came due in fiscal 2005. These cash outflows contributed to repayments
of debt totaling €848 million in fiscal 2005 and €1.564 billion in fiscal 2004. The current period
also includes net proceeds from the issuance of short-term debt, primarily commercial paper.
In fiscal 2005, Siemens’ shareholders benefited as we paid €1.112 billion in dividends, up from
€978 million in the year earlier.
Management’s discussion and analysis
Liquidity and capital resources
SFS, SRE and
Continuing operations Operations Corporate Treasury* Siemens
Year ended September 30,
(€ in millions) 2005 2004 2005 2004 2005 2004
Net cash provided by (used in):
Operating activities 3,565 3,635 652 1,069 4,217 4,704
Investing activities (4,787) (1,394) (919) (295) (5,706) (1,689)
Net cash provided by (used in)
operating and investing activities
– continuing operations (1,222) 2,241 (267) 774 (1,489) 3,015
* Also includes eliminations and reclassifications.