Siemens 2005 Annual Report Download - page 188
Download and view the complete annual report
Please find page 188 of the 2005 Siemens annual report below. You can navigate through the pages in the report by either clicking on the pages listed below, or by using the keyword search tool below to find specific information within the annual report.-
 1
1 -
2
-
3
-
4
-
5
-
6
-
7
-
8
-
9
-
10
-
11
-
12
-
13
-
14
-
15
-
16
-
17
-
18
-
19
-
20
-
21
-
22
-
23
-
24
-
25
-
26
-
27
-
28
-
29
-
30
-
31
-
32
-
33
-
34
-
35
-
36
-
37
-
38
-
39
-
40
-
41
-
42
-
43
-
44
-
45
-
46
-
47
-
48
-
49
-
50
-
51
-
52
-
53
-
54
-
55
-
56
-
57
-
58
-
59
-
60
-
61
-
62
-
63
-
64
-
65
-
66
-
67
-
68
-
69
-
70
-
71
-
72
-
73
-
74
-
75
-
76
-
77
-
78
-
79
-
80
-
81
-
82
-
83
-
84
-
85
-
86
-
87
-
88
-
89
-
90
-
91
-
92
-
93
-
94
-
95
-
96
-
97
-
98
-
99
-
100
-
101
-
102
-
103
-
104
-
105
-
106
-
107
-
108
-
109
-
110
-
111
-
112
-
113
-
114
-
115
-
116
-
117
-
118
-
119
-
120
-
121
-
122
-
123
-
124
-
125
-
126
-
127
-
128
-
129
-
130
-
131
-
132
-
133
-
134
-
135
-
136
-
137
-
138
-
139
-
140
-
141
-
142
-
143
-
144
-
145
-
146
-
147
-
148
-
149
-
150
-
151
-
152
-
153
-
154
-
155
-
156
-
157
-
158
-
159
-
160
-
161
-
162
-
163
-
164
-
165
-
166
-
167
-
168
-
169
-
170
-
171
-
172
-
173
-
174
-
175
-
176
-
177
-
 178
178 -
 179
179 -
 180
180 -
 181
181 -
 182
182 -
 183
183 -
 184
184 -
 185
185 -
 186
186 -
 187
187 -
 188
188 -
 189
189 -
 190
190 -
 191
191 -
 192
192 -
 193
193 -
 194
194 -
 195
195 -
 196
196 -
 197
197 -
 198
198 -
199
-
200
-
201
-
202
-
203
-
204
-
205
-
206
-
207
-
208
-
209
-
210
-
211
-
212
-
213
-
214
-
215
-
216
-
217
-
218
-
219
-
220
-
221
-
222
-
223
-
224
-
225
-
226
-
227
-
228
-
229
-
230
-
231
-
232
 |
 |

188
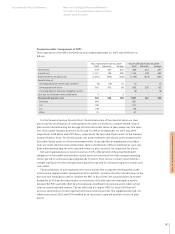
Other postretirement benefits: Plan assets
The following table shows the change in plan assets for fiscal 2005 and 2004:
Other postretirement benefits: Components of net periodic benefit cost
The components of the net periodic benefit cost for other postretirement benefits for the years
ended September 30, 2005 and 2004 are as follows:
Other postretirement benefits: Assumptions used in the calculation of the APBO and net
periodic benefit cost
Discount rates and other key assumptions used for transition payments in Germany are the same
as those utilized for domestic pension benefit plans.
The weighted-average assumptions used in calculating the actuarial values for the postretire-
ment healthcare and life insurance benefits, primarily in the U.S., are as follows:
Management’s discussion and analysis
September 30, 2005 September 30, 2004
Total Domestic Foreign Total Domestic Foreign
Change in plan assets
Fair value of plan assets at beginning of year 5 – 5 3 – 3
Employer contributions 31 – 31 32 – 32
Plan participant’s contributions 2 – 2 2 – 2
Benefits paid (35) – (35) (32) – (32)
Fair value of plan assets at year end 3 – 3 5 – 5
Year ended September 30, 2005 Year ended September 30, 2004
Total Domestic Foreign Total Domestic Foreign
Service cost 26 14 12 44 17 27
Interest cost 52 23 29 60 26 34
Amortization of:
Unrecognized prior service benefits (10) – (10) (7) – (7)
Unrecognized net (gains)/losses (19) (15) (4) (10) (12) 2
Net gain due to settlements and curtailments (4) – (4) (3) – (3)
Net periodic benefit cost 45 22 23 84 31 53
Year ended September 30,
2005 2004
Discount rate 5.25% 6.5%
Medical trend rates (initial/ultimate /year):
Medicare ineligible pre-65 9%/5%/2010 10%/5%/2010
Medicare eligible post-65 9%/5%/2010 10%/5%/2010
Fixed dollar benefit 4.5% 4.5%
Dental trend rates (initial/ultimate/year) 6%/5%/2021 6%/5%/2021