Siemens 2005 Annual Report Download - page 107
Download and view the complete annual report
Please find page 107 of the 2005 Siemens annual report below. You can navigate through the pages in the report by either clicking on the pages listed below, or by using the keyword search tool below to find specific information within the annual report.-
 1
1 -
2
-
3
-
4
-
5
-
6
-
7
-
8
-
9
-
10
-
11
-
12
-
13
-
14
-
15
-
16
-
17
-
18
-
19
-
20
-
21
-
22
-
23
-
24
-
25
-
26
-
27
-
28
-
29
-
30
-
31
-
32
-
33
-
34
-
35
-
36
-
37
-
38
-
39
-
40
-
41
-
42
-
43
-
44
-
45
-
46
-
47
-
48
-
49
-
50
-
51
-
52
-
53
-
54
-
55
-
56
-
57
-
58
-
59
-
60
-
61
-
62
-
63
-
64
-
65
-
66
-
67
-
68
-
69
-
70
-
71
-
72
-
73
-
74
-
75
-
76
-
77
-
78
-
79
-
80
-
81
-
82
-
83
-
84
-
85
-
86
-
87
-
88
-
89
-
90
-
91
-
92
-
93
-
94
-
95
-
96
-
 97
97 -
 98
98 -
 99
99 -
 100
100 -
 101
101 -
 102
102 -
 103
103 -
 104
104 -
 105
105 -
 106
106 -
 107
107 -
 108
108 -
 109
109 -
 110
110 -
 111
111 -
 112
112 -
 113
113 -
 114
114 -
 115
115 -
 116
116 -
 117
117 -
118
-
119
-
120
-
121
-
122
-
123
-
124
-
125
-
126
-
127
-
128
-
129
-
130
-
131
-
132
-
133
-
134
-
135
-
136
-
137
-
138
-
139
-
140
-
141
-
142
-
143
-
144
-
145
-
146
-
147
-
148
-
149
-
150
-
151
-
152
-
153
-
154
-
155
-
156
-
157
-
158
-
159
-
160
-
161
-
162
-
163
-
164
-
165
-
166
-
167
-
168
-
169
-
170
-
171
-
172
-
173
-
174
-
175
-
176
-
177
-
178
-
179
-
180
-
181
-
182
-
183
-
184
-
185
-
186
-
187
-
188
-
189
-
190
-
191
-
192
-
193
-
194
-
195
-
196
-
197
-
198
-
199
-
200
-
201
-
202
-
203
-
204
-
205
-
206
-
207
-
208
-
209
-
210
-
211
-
212
-
213
-
214
-
215
-
216
-
217
-
218
-
219
-
220
-
221
-
222
-
223
-
224
-
225
-
226
-
227
-
228
-
229
-
230
-
231
-
232
 |
 |

107
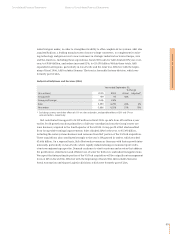
These assumptions and the effective market risk for our Operations Groups result in the fol-
lowing figures of Weighted Average Cost of Capital (WACC):
In order to determine the capital charge for each Operations Group, the respective percentage
is applied against the average net operating assets. Average net operating assets were determined
on a monthly basis, principally based on net capital employed.
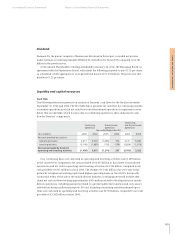
In the case of Financing and Real Estate, we use the financial concept to calculate the EVA. As
the base measure we use income before income taxes and apply the above mentioned flat tax rate
to arrive at the net operating profit after taxes. From this result, we deduct the capital charge,
which is calculated by multiplying the cost of capital expressed as a percentage by the risk-adjust-
ed equity allocated to this component. Since the cost of debt is already considered within the
income before income taxes, the cost of capital is only based on equity components. The EVA for
Corporate Treasury is calculated similarly to Financing and Real Estate.
The cost of risk-oriented equity of the Financing and Real Estate Groups was also adjusted to
the changes in our business environment. The following table illustrates the current and the for-
mer percentages of our cost of equity:
At the beginning of the fiscal year 2005, the EVA calculation based on our component model
was further improved for the Operations Groups. This occurred by also applying the financial
concept to the pensions, which are centrally held.
Other organizations that use EVA as a measure of financial performance may define and calcu-
late EVA differently. To better enable comparison of the current performance with the perform-
ance of the previous year, all EVA figures of fiscal 2004 presented below are based on the assump-
tions of fiscal year 2005.
Management’s discussion and analysis
Consolidated Financial Statements Notes to Consolidated Financial Statements
WACC
new old
Operations Groups
Communications (Com) 8.5% 10%
Siemens Business Services (SBS) 7.5% 10%
Automation and Drives (A&D) 6.5% 9%
Industrial Solutions and Services (I&S) 7% 9%
Logistics and Assembly Systems (L&A) 7% 9%
Siemens Building Technologies (SBT) 7% 8%
Power Generation (PG) 7% 9%
Power Transmission and Distribution (PTD) 7% 9%
Transportation Systems (TS) 7% 9%
Siemens VDO Automotive (SV) 7% 9%
Medical Solutions (Med) 7% 9%
Osram 6.5% 8%
Cost of equity
new old
Financing and Real Estate Groups
Siemens Financial Services (SFS) 7.5% 9.75%
Siemens Real Estate (SRE) 6.5% 8%