Siemens 2005 Annual Report Download - page 102
Download and view the complete annual report
Please find page 102 of the 2005 Siemens annual report below. You can navigate through the pages in the report by either clicking on the pages listed below, or by using the keyword search tool below to find specific information within the annual report.-
 1
1 -
2
-
3
-
4
-
5
-
6
-
7
-
8
-
9
-
10
-
11
-
12
-
13
-
14
-
15
-
16
-
17
-
18
-
19
-
20
-
21
-
22
-
23
-
24
-
25
-
26
-
27
-
28
-
29
-
30
-
31
-
32
-
33
-
34
-
35
-
36
-
37
-
38
-
39
-
40
-
41
-
42
-
43
-
44
-
45
-
46
-
47
-
48
-
49
-
50
-
51
-
52
-
53
-
54
-
55
-
56
-
57
-
58
-
59
-
60
-
61
-
62
-
63
-
64
-
65
-
66
-
67
-
68
-
69
-
70
-
71
-
72
-
73
-
74
-
75
-
76
-
77
-
78
-
79
-
80
-
81
-
82
-
83
-
84
-
85
-
86
-
87
-
88
-
89
-
90
-
91
-
 92
92 -
 93
93 -
 94
94 -
 95
95 -
 96
96 -
 97
97 -
 98
98 -
 99
99 -
 100
100 -
 101
101 -
 102
102 -
 103
103 -
 104
104 -
 105
105 -
 106
106 -
 107
107 -
 108
108 -
 109
109 -
 110
110 -
 111
111 -
 112
112 -
113
-
114
-
115
-
116
-
117
-
118
-
119
-
120
-
121
-
122
-
123
-
124
-
125
-
126
-
127
-
128
-
129
-
130
-
131
-
132
-
133
-
134
-
135
-
136
-
137
-
138
-
139
-
140
-
141
-
142
-
143
-
144
-
145
-
146
-
147
-
148
-
149
-
150
-
151
-
152
-
153
-
154
-
155
-
156
-
157
-
158
-
159
-
160
-
161
-
162
-
163
-
164
-
165
-
166
-
167
-
168
-
169
-
170
-
171
-
172
-
173
-
174
-
175
-
176
-
177
-
178
-
179
-
180
-
181
-
182
-
183
-
184
-
185
-
186
-
187
-
188
-
189
-
190
-
191
-
192
-
193
-
194
-
195
-
196
-
197
-
198
-
199
-
200
-
201
-
202
-
203
-
204
-
205
-
206
-
207
-
208
-
209
-
210
-
211
-
212
-
213
-
214
-
215
-
216
-
217
-
218
-
219
-
220
-
221
-
222
-
223
-
224
-
225
-
226
-
227
-
228
-
229
-
230
-
231
-
232
 |
 |

102
Transportation
Transportation Systems (TS)
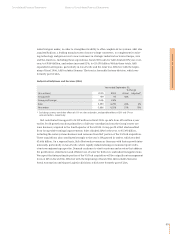
TS recorded Group profit of €45 million in fiscal 2005 and continued to stabilize its opera-
tions. For comparison, the loss of €434 million a year earlier included significantly higher
charges in the Group’s rolling stock business, primarily related to the Combino low-floor trams
but also for other projects. While sales for the year came in at €4.190 billion, 3% below the prior-
year level, orders rose 6%, to €4.599 billion. TS continued to expand its orders outside its tradi-
tional markets in Germany and other European countries, particularly in Asia-Pacific where the
increasing number of large cities with growing populations gives rise to greater demand for
urban transit systems. Demand in the German market continued to decline in fiscal 2005, as a
result of reduced government funding of rail transportation systems. Margin pressures contin-
ued to intensify on an industry-wide basis, due to increases in competition, privatization, and
customer requirements.
Siemens VDO Automotive (SV)
SV increased its fiscal 2005 Group profit 12%, to €630 million, leveraging a larger revenue
base with a more favorable sales mix. The Group also continued to realize significant benefits
from on-going cost-cutting and efficiency measures in a slower-growing automotive market.
Sales were up 7%, to €9.610 billion, primarily due to full-year consolidation of a U.S. unit acquired
in the middle of fiscal 2004 to meet rising demand for advanced automotive electronics and to
strengthen its position in the U.S. market. The same factors accounted for a broad-based 8%
increase in orders, to €9.787 billion for the year.
Management’s discussion and analysis
Segment information analysis
Year ended September 30,
% Change
(€ in millions) 2005 2004 Actual Adjusted*
Group profit 45 (434)
Group profit margin 1.1% (10.1)%
Sales 4,190 4,310 (3)% (3)%
New orders 4,599 4,321 6% 6%
* Excluding currency translation effects.
Year ended September 30,
% Change
(€ in millions) 2005 2004 Actual Adjusted*
Group profit 630 562 12%
Group profit margin 6.6% 6.2%
Sales 9,610 9,001 7% 2%
New orders 9,787 9,029 8% 3%
* Excluding portfolio effects of 5% on sales and orders.