Siemens 2005 Annual Report Download - page 95
Download and view the complete annual report
Please find page 95 of the 2005 Siemens annual report below. You can navigate through the pages in the report by either clicking on the pages listed below, or by using the keyword search tool below to find specific information within the annual report.-
 1
1 -
2
-
3
-
4
-
5
-
6
-
7
-
8
-
9
-
10
-
11
-
12
-
13
-
14
-
15
-
16
-
17
-
18
-
19
-
20
-
21
-
22
-
23
-
24
-
25
-
26
-
27
-
28
-
29
-
30
-
31
-
32
-
33
-
34
-
35
-
36
-
37
-
38
-
39
-
40
-
41
-
42
-
43
-
44
-
45
-
46
-
47
-
48
-
49
-
50
-
51
-
52
-
53
-
54
-
55
-
56
-
57
-
58
-
59
-
60
-
61
-
62
-
63
-
64
-
65
-
66
-
67
-
68
-
69
-
70
-
71
-
72
-
73
-
74
-
75
-
76
-
77
-
78
-
79
-
80
-
81
-
82
-
83
-
84
-
 85
85 -
 86
86 -
 87
87 -
 88
88 -
 89
89 -
 90
90 -
 91
91 -
 92
92 -
 93
93 -
 94
94 -
 95
95 -
 96
96 -
 97
97 -
 98
98 -
 99
99 -
 100
100 -
 101
101 -
 102
102 -
 103
103 -
 104
104 -
 105
105 -
106
-
107
-
108
-
109
-
110
-
111
-
112
-
113
-
114
-
115
-
116
-
117
-
118
-
119
-
120
-
121
-
122
-
123
-
124
-
125
-
126
-
127
-
128
-
129
-
130
-
131
-
132
-
133
-
134
-
135
-
136
-
137
-
138
-
139
-
140
-
141
-
142
-
143
-
144
-
145
-
146
-
147
-
148
-
149
-
150
-
151
-
152
-
153
-
154
-
155
-
156
-
157
-
158
-
159
-
160
-
161
-
162
-
163
-
164
-
165
-
166
-
167
-
168
-
169
-
170
-
171
-
172
-
173
-
174
-
175
-
176
-
177
-
178
-
179
-
180
-
181
-
182
-
183
-
184
-
185
-
186
-
187
-
188
-
189
-
190
-
191
-
192
-
193
-
194
-
195
-
196
-
197
-
198
-
199
-
200
-
201
-
202
-
203
-
204
-
205
-
206
-
207
-
208
-
209
-
210
-
211
-
212
-
213
-
214
-
215
-
216
-
217
-
218
-
219
-
220
-
221
-
222
-
223
-
224
-
225
-
226
-
227
-
228
-
229
-
230
-
231
-
232
 |
 |

95
with strong growth at the Industrial Automation and Motion Control divisions, as well as through
higher revenues. In fiscal 2005, SV’s gross profit primarily benefited from increased revenues
and a favorable sales mix. I&S’ higher gross profit was mainly due to a full-year contribution of
the Group’s water systems business. Negative operating results and charges for severance and
capacity adjustments led to a significant gross profit decline at SBS.
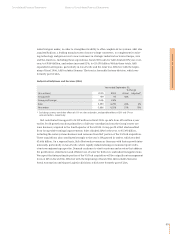
R&D expenses increased €505 million in fiscal 2005, to €5.155 billion. This amount was up
significantly from €4.650 billion in fiscal 2004. R&D spending as a percentage of sales rose to
6.8% compared to 6.6% in fiscal 2004.
Siemens’ marketing, selling and general administrative expenses were €13.684 billion, com-
pared to €12.828 billion in fiscal 2004, driven primarily by higher costs at Com. Expenses at I&S
were also higher, due to the water systems acquisition in the prior year. Due to rising sales, mar-
keting, selling and general administrative expenses fell to 18.1% of sales compared to 18.3% in
fiscal 2004.
Other operating income (expense), net was a negative €9 million compared to a negative €172
million in fiscal 2004. Included in these amounts were goodwill impairments of €262 million at
SBS in fiscal 2005 and €433 million related to airport logistics and distribution and industry
logistics activities in fiscal 2004. Gains on sales of real estate, net of €177 million in fiscal 2005
were higher than €64 million in the prior year. The increase in fiscal 2005 was primarily due to
significant gains in Operations as well as Financing and Real Estate activities. Gains on sales and
disposals of businesses, net, of €49 million, were lower than €182 million in fiscal 2004, which
included the sale of Med’s Life Support Systems (LSS) business and SBS’ sale of a 74.9% interest in
its Kordoba KG (Kordoba) banking software business.
Management’s discussion and analysis
Consolidated Financial Statements Notes to Consolidated Financial Statements
(€ in millions) 2005 2004
Research and development expenses (5,155) (4,650)
as percentage of sales 6.8% 6.6%
Marketing, selling and general administrative expenses (13,684) (12,828)
as percentage of sales 18.1% 18.3%
Other operating income (expense), net (9) (172)
Income from investments in other companies, net 584 1,031
Income from financial assets and marketable securities, net 297 69
Interest income (expense) of Operations, net (32) 20
Other interest income, net 241 254