Siemens 2005 Annual Report Download - page 108
Download and view the complete annual report
Please find page 108 of the 2005 Siemens annual report below. You can navigate through the pages in the report by either clicking on the pages listed below, or by using the keyword search tool below to find specific information within the annual report.-
 1
1 -
2
-
3
-
4
-
5
-
6
-
7
-
8
-
9
-
10
-
11
-
12
-
13
-
14
-
15
-
16
-
17
-
18
-
19
-
20
-
21
-
22
-
23
-
24
-
25
-
26
-
27
-
28
-
29
-
30
-
31
-
32
-
33
-
34
-
35
-
36
-
37
-
38
-
39
-
40
-
41
-
42
-
43
-
44
-
45
-
46
-
47
-
48
-
49
-
50
-
51
-
52
-
53
-
54
-
55
-
56
-
57
-
58
-
59
-
60
-
61
-
62
-
63
-
64
-
65
-
66
-
67
-
68
-
69
-
70
-
71
-
72
-
73
-
74
-
75
-
76
-
77
-
78
-
79
-
80
-
81
-
82
-
83
-
84
-
85
-
86
-
87
-
88
-
89
-
90
-
91
-
92
-
93
-
94
-
95
-
96
-
97
-
 98
98 -
 99
99 -
 100
100 -
 101
101 -
 102
102 -
 103
103 -
 104
104 -
 105
105 -
 106
106 -
 107
107 -
 108
108 -
 109
109 -
 110
110 -
 111
111 -
 112
112 -
 113
113 -
 114
114 -
 115
115 -
 116
116 -
 117
117 -
 118
118 -
119
-
120
-
121
-
122
-
123
-
124
-
125
-
126
-
127
-
128
-
129
-
130
-
131
-
132
-
133
-
134
-
135
-
136
-
137
-
138
-
139
-
140
-
141
-
142
-
143
-
144
-
145
-
146
-
147
-
148
-
149
-
150
-
151
-
152
-
153
-
154
-
155
-
156
-
157
-
158
-
159
-
160
-
161
-
162
-
163
-
164
-
165
-
166
-
167
-
168
-
169
-
170
-
171
-
172
-
173
-
174
-
175
-
176
-
177
-
178
-
179
-
180
-
181
-
182
-
183
-
184
-
185
-
186
-
187
-
188
-
189
-
190
-
191
-
192
-
193
-
194
-
195
-
196
-
197
-
198
-
199
-
200
-
201
-
202
-
203
-
204
-
205
-
206
-
207
-
208
-
209
-
210
-
211
-
212
-
213
-
214
-
215
-
216
-
217
-
218
-
219
-
220
-
221
-
222
-
223
-
224
-
225
-
226
-
227
-
228
-
229
-
230
-
231
-
232
 |
 |

108
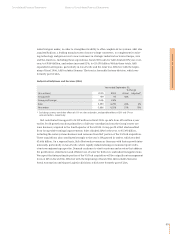
Based on continuing operations, Siemens created EVA of €1.311 billion in fiscal 2005 com-
pared to €1.720 billion a year earlier. Including discontinued operations, EVA was €414 million in
fiscal 2005. For comparison, EVA of €1.620 billion in the prior year included the Infineon gain and
goodwill impairment mentioned above.
Management’s discussion and analysis
EVA performance
Dividend
Liquidity and capital resources
(1) To conform with to the current year presentation EVA of fiscal 2004 has been calculated according to the assumptions used in fiscal 2005. For further information see
discussion above.
(2) The income taxes of Eliminations, reclassifications and Corporate Treasury, Operations, and Financing and Real Estate are based on the consolidated effective
corporate tax rate applied to income before income taxes.
(3) The term “Net operating assets” is the same as Net capital employed except the effects of financial adjustments and the fact that Average net operating assets are
calculated on a monthly basis. The average net operating assets of discontinued operations have been eliminated for both fiscal years.
(4) As a result of allocated equity, liabilities are also partly allocated.
(5) Capital charge for Eliminations, reclassifications and Corporate Treasury is risk-determined.
Economic Value Added (EVA) calculation
For the fiscal years ended September 30, 2005 and 2004(1)
Eliminations,
reclassifications and Financing and
Siemens Corporate Treasury Operations Real Estate
(€ in millions) 2005 2004 2005 2004 2005 2004 2005 2004
Income from continuing operations 3,058 3,450 228 185 2,475 2,972 355 293
Minority interest 148 152 – – 148 152 – –
Income taxes(2) 979 767 70 39 801 665 108 63
Income from continuing operations
before income taxes 4,185 4,369 298 224 3,424 3,789 463 356
Other interest income (expense)
of Operations, net 191 141 – – 191 141 – –
Taxes and financial adjustments (1,094) (1,001) (90) (67) (902) (842) (102) (92)
Net operating profit from continuing
operations after taxes 3,282 3,509 208 157 2,713 3,088 361 264
Sept. 30, Sept. 30, Sept. 30, Sept. 30, Sept. 30, Sept. 30, Sept. 30, Sept. 30,
2005 2004 2005 2004 2005 2004 2005 2004
Total assets 86,205 79,518 (8,553) (343) 81,454 67,927 13,304 11,934
Other asset related and miscellaneous
reconciling items (see table segment information) – – – – (59,787) (49,821) – –
Financial adjustments – – – – 927 1,114 – –
Pension adjustment and average calculation(3) – – – – 3,133 3,950 – –
Liabilities(4) – – – – – – (11,401) (9,999)
Average net operating assets for Operations
(continuing operations) / allocated equity
for Financing and Real Estate – – – – 25,727 23,170 1,903 1,935
2005 2004 2005 2004 2005 2004 2005 2004
Net operating profit from continuing
operations after taxes 3,282 3,509 208 157 2,713 3,088 361 264
Capital charge(5) (1,971) (1,789) (13) (11) (1,825) (1,644) (133) (134)
EVA from continuing operations 1,311 1,720 195 146 888 1,444 228 130
EVA from discontinued operations (897) (100) – – (897) (99) – (1)
EVA from continuing and discontinued operations 414 1,620 195 146 (9) 1,345 228 129