Siemens 2005 Annual Report Download - page 183
Download and view the complete annual report
Please find page 183 of the 2005 Siemens annual report below. You can navigate through the pages in the report by either clicking on the pages listed below, or by using the keyword search tool below to find specific information within the annual report.-
 1
1 -
2
-
3
-
4
-
5
-
6
-
7
-
8
-
9
-
10
-
11
-
12
-
13
-
14
-
15
-
16
-
17
-
18
-
19
-
20
-
21
-
22
-
23
-
24
-
25
-
26
-
27
-
28
-
29
-
30
-
31
-
32
-
33
-
34
-
35
-
36
-
37
-
38
-
39
-
40
-
41
-
42
-
43
-
44
-
45
-
46
-
47
-
48
-
49
-
50
-
51
-
52
-
53
-
54
-
55
-
56
-
57
-
58
-
59
-
60
-
61
-
62
-
63
-
64
-
65
-
66
-
67
-
68
-
69
-
70
-
71
-
72
-
73
-
74
-
75
-
76
-
77
-
78
-
79
-
80
-
81
-
82
-
83
-
84
-
85
-
86
-
87
-
88
-
89
-
90
-
91
-
92
-
93
-
94
-
95
-
96
-
97
-
98
-
99
-
100
-
101
-
102
-
103
-
104
-
105
-
106
-
107
-
108
-
109
-
110
-
111
-
112
-
113
-
114
-
115
-
116
-
117
-
118
-
119
-
120
-
121
-
122
-
123
-
124
-
125
-
126
-
127
-
128
-
129
-
130
-
131
-
132
-
133
-
134
-
135
-
136
-
137
-
138
-
139
-
140
-
141
-
142
-
143
-
144
-
145
-
146
-
147
-
148
-
149
-
150
-
151
-
152
-
153
-
154
-
155
-
156
-
157
-
158
-
159
-
160
-
161
-
162
-
163
-
164
-
165
-
166
-
167
-
168
-
169
-
170
-
171
-
172
-
 173
173 -
 174
174 -
 175
175 -
 176
176 -
 177
177 -
 178
178 -
 179
179 -
 180
180 -
 181
181 -
 182
182 -
 183
183 -
 184
184 -
 185
185 -
 186
186 -
 187
187 -
 188
188 -
 189
189 -
 190
190 -
 191
191 -
 192
192 -
 193
193 -
194
-
195
-
196
-
197
-
198
-
199
-
200
-
201
-
202
-
203
-
204
-
205
-
206
-
207
-
208
-
209
-
210
-
211
-
212
-
213
-
214
-
215
-
216
-
217
-
218
-
219
-
220
-
221
-
222
-
223
-
224
-
225
-
226
-
227
-
228
-
229
-
230
-
231
-
232
 |
 |

183
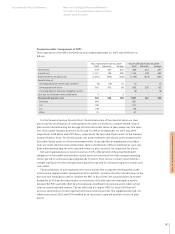
The weighted-average assumptions used for determining the NPPC for the fiscal years ended
September 30, 2006, 2005 and 2004 are shown in the following table:
The discount rate assumptions reflect the rates available on high-quality, fixed-income invest-
ments of appropriate duration at the measurement date of each plan. The expected return on plan
assets is determined on a uniform basis, considering long-term historical returns, asset alloca-
tion, and future estimates of long-term investment returns. Actuarial assumptions not shown in
the table above, such as employee turnover, mortality, disability, etc., remained primarily
unchanged in 2005.
Notes to Consolidated Financial Statements
Consolidated Financial Statements Notes to Consolidated Financial Statements
(in millions of €, except where otherwise stated
and per share amounts)
Year ended September 30, 2006 Year ended September 30, 2005 Year ended September 30, 2004
Total Domestic Foreign Total Domestic Foreign Total Domestic Foreign
Discount rate 4.5% 4.35% 4.9% 5.5% 5.25% 5.9% 5.4% 5.25% 5.6%
Germany 4.35% 5.25% 5.25%
U.S. 5.25% 6.5% 6.25%
U.K. 4.9% 5.7% 5.4%
Expected return on plan assets 6.7% 6.7% 6.7% 6.7% 6.75% 6.6% 6.7% 6.75% 6.6%
Germany 6.7% 6.75% 6.75%
U.S. 6.95% 6.95% 6.95%
U.K. 6.75% 6.85% 6.85%
Rate of compensation increase 2.6% 2.25% 3.2% 2.6% 2.25% 3.3% 2.5% 2.25% 2.9%
Germany 2.25% 2.25% 2.25%
U.S. 3.25% 3.25% 3.0%
U.K. 3.7% 4.0% 3.6%
Rate of pension progression 1.2% 1.0% 2.0% 1.3% 1.0% 2.3% 1.4% 1.25% 2.1%
Germany 1.0% 1.0% 1.25%
U.K. 2.7% 2.8% 2.6%