Siemens 2005 Annual Report Download - page 96
Download and view the complete annual report
Please find page 96 of the 2005 Siemens annual report below. You can navigate through the pages in the report by either clicking on the pages listed below, or by using the keyword search tool below to find specific information within the annual report.-
 1
1 -
2
-
3
-
4
-
5
-
6
-
7
-
8
-
9
-
10
-
11
-
12
-
13
-
14
-
15
-
16
-
17
-
18
-
19
-
20
-
21
-
22
-
23
-
24
-
25
-
26
-
27
-
28
-
29
-
30
-
31
-
32
-
33
-
34
-
35
-
36
-
37
-
38
-
39
-
40
-
41
-
42
-
43
-
44
-
45
-
46
-
47
-
48
-
49
-
50
-
51
-
52
-
53
-
54
-
55
-
56
-
57
-
58
-
59
-
60
-
61
-
62
-
63
-
64
-
65
-
66
-
67
-
68
-
69
-
70
-
71
-
72
-
73
-
74
-
75
-
76
-
77
-
78
-
79
-
80
-
81
-
82
-
83
-
84
-
85
-
 86
86 -
 87
87 -
 88
88 -
 89
89 -
 90
90 -
 91
91 -
 92
92 -
 93
93 -
 94
94 -
 95
95 -
 96
96 -
 97
97 -
 98
98 -
 99
99 -
 100
100 -
 101
101 -
 102
102 -
 103
103 -
 104
104 -
 105
105 -
 106
106 -
107
-
108
-
109
-
110
-
111
-
112
-
113
-
114
-
115
-
116
-
117
-
118
-
119
-
120
-
121
-
122
-
123
-
124
-
125
-
126
-
127
-
128
-
129
-
130
-
131
-
132
-
133
-
134
-
135
-
136
-
137
-
138
-
139
-
140
-
141
-
142
-
143
-
144
-
145
-
146
-
147
-
148
-
149
-
150
-
151
-
152
-
153
-
154
-
155
-
156
-
157
-
158
-
159
-
160
-
161
-
162
-
163
-
164
-
165
-
166
-
167
-
168
-
169
-
170
-
171
-
172
-
173
-
174
-
175
-
176
-
177
-
178
-
179
-
180
-
181
-
182
-
183
-
184
-
185
-
186
-
187
-
188
-
189
-
190
-
191
-
192
-
193
-
194
-
195
-
196
-
197
-
198
-
199
-
200
-
201
-
202
-
203
-
204
-
205
-
206
-
207
-
208
-
209
-
210
-
211
-
212
-
213
-
214
-
215
-
216
-
217
-
218
-
219
-
220
-
221
-
222
-
223
-
224
-
225
-
226
-
227
-
228
-
229
-
230
-
231
-
232
 |
 |

96
Income from investments in other companies, net was €584 million compared to €1.031 bil-
lion in the prior year, which included the Infineon share sale gain of €590 million. Income from
financial assets and marketable securities, net was €297 million, up from €69 million in fiscal
2004, due primarily to the €208 million gain on the sale of Juniper Networks Inc. (Juniper) shares
at Com.
Income taxes on Siemens’ income from continuing operations were 23%, up from 18% in fiscal
2004. In fiscal 2005, our income tax rate was reduced due to a reorganization of certain business-
es in the U.S generating previously unrecognized tax deductions. The fiscal 2004 income tax rate
benefited from the Infineon share sale gain and related €246 million reversal in deferred tax lia-
bilities. Non-deductible goodwill impairments also impacted the rate in both fiscal years.
For the fiscal year ended September 30, 2005, Siemens reported income from continuing oper-
ations of €3.058 billion compared to €3.450 billion due to the factors mentioned above. Based on
income from continuing operations, basic and diluted earnings per share were €3.43 and €3.29,
respectively, compared to €3.87 and €3.71 a year earlier. Discontinued operations in fiscal 2005
were a negative €810 million due to operating losses, asset impairments, and a loss on the sale of
Com’s mobile devices business. We do not expect future earnings to be materially impacted by the
discontinued mobile devices activities. For additional information with respect to discontinued
operations, see “Notes to Consolidated Financial Statements.” Net income, which includes discon-
tinued operations, was €2.248 billion. Net income of €3.405 billion a year earlier also includes the
€403 net benefit mentioned above. Basic and diluted earnings per share were €2.52 and €2.42,
respectively, compared to €3.82 and €3.66 a year earlier.
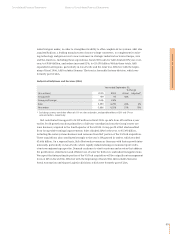
Management’s discussion and analysis
Fiscal 2005 – Results of Siemens
Segment information analysis
(€ in millions) 2005 2004
Income from continuing operations before income taxes 4,185 4,369
Income taxes (979) (767)
as percentage of income from continuing operations before income taxes 23% 18%
Income from continuing operations 3,058 3,450
Income (loss) from discontinued operations, net of income taxes (810) (45)
Net income 2,248 3,405