Siemens 2005 Annual Report Download - page 109
Download and view the complete annual report
Please find page 109 of the 2005 Siemens annual report below. You can navigate through the pages in the report by either clicking on the pages listed below, or by using the keyword search tool below to find specific information within the annual report.-
 1
1 -
2
-
3
-
4
-
5
-
6
-
7
-
8
-
9
-
10
-
11
-
12
-
13
-
14
-
15
-
16
-
17
-
18
-
19
-
20
-
21
-
22
-
23
-
24
-
25
-
26
-
27
-
28
-
29
-
30
-
31
-
32
-
33
-
34
-
35
-
36
-
37
-
38
-
39
-
40
-
41
-
42
-
43
-
44
-
45
-
46
-
47
-
48
-
49
-
50
-
51
-
52
-
53
-
54
-
55
-
56
-
57
-
58
-
59
-
60
-
61
-
62
-
63
-
64
-
65
-
66
-
67
-
68
-
69
-
70
-
71
-
72
-
73
-
74
-
75
-
76
-
77
-
78
-
79
-
80
-
81
-
82
-
83
-
84
-
85
-
86
-
87
-
88
-
89
-
90
-
91
-
92
-
93
-
94
-
95
-
96
-
97
-
98
-
 99
99 -
 100
100 -
 101
101 -
 102
102 -
 103
103 -
 104
104 -
 105
105 -
 106
106 -
 107
107 -
 108
108 -
 109
109 -
 110
110 -
 111
111 -
 112
112 -
 113
113 -
 114
114 -
 115
115 -
 116
116 -
 117
117 -
 118
118 -
 119
119 -
120
-
121
-
122
-
123
-
124
-
125
-
126
-
127
-
128
-
129
-
130
-
131
-
132
-
133
-
134
-
135
-
136
-
137
-
138
-
139
-
140
-
141
-
142
-
143
-
144
-
145
-
146
-
147
-
148
-
149
-
150
-
151
-
152
-
153
-
154
-
155
-
156
-
157
-
158
-
159
-
160
-
161
-
162
-
163
-
164
-
165
-
166
-
167
-
168
-
169
-
170
-
171
-
172
-
173
-
174
-
175
-
176
-
177
-
178
-
179
-
180
-
181
-
182
-
183
-
184
-
185
-
186
-
187
-
188
-
189
-
190
-
191
-
192
-
193
-
194
-
195
-
196
-
197
-
198
-
199
-
200
-
201
-
202
-
203
-
204
-
205
-
206
-
207
-
208
-
209
-
210
-
211
-
212
-
213
-
214
-
215
-
216
-
217
-
218
-
219
-
220
-
221
-
222
-
223
-
224
-
225
-
226
-
227
-
228
-
229
-
230
-
231
-
232
 |
 |

109
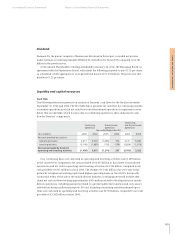
Dividend
Siemens AG, the parent company of businesses discussed in this report, recorded net income
under German accounting principles (HGB) of €1.451 billion for fiscal 2005 compared to €2.181
billion in the previous year.
At the Annual Shareholders’ Meeting scheduled for January 26, 2006, the Managing Board, in
agreement with the Supervisory Board, will submit the following proposal: to pay €1.35 per share
as a dividend, which aggregates to an expected total payout of €1.203 billion. The prior-year divi-
dend was €1.25 per share.
Liquidity and capital resources
Cash flow
The following discussion presents an analysis of Siemens’ cash flows for the fiscal years ended
September 30, 2005 and 2004. The first table below presents net cash flow for continuing and dis-
continued operations in which net cash flow from discontinued operations is explained in more
detail. The second table, which focuses only on continuing operations, then analyzes net cash
flow for Siemens’ components.
On a continuing basis, net cash used in operating and investing activities was €1.489 billion
in the current year compared to net cash provided of €3.015 billion in fiscal 2004. Discontinued
operations used net cash in operating and investing activities of €1.214 billion, compared to net
cash provided of €247 million in fiscal 2004. The change of €1.461 billion year-over-year is due
primarily to higher net working capital and higher operating losses in fiscal 2005. In line with
contractual terms of the sale of the mobile devices business, coming quarters will include addi-
tional net cash outflows totaling approximately €500 million related to the disposition of mobile
devices operations, including payments related to a product platform transition and costs associ-
ated with securing intellectual property. In total, including continuing and discontinued opera-
tions, net cash used in operating and investing activities was €2.703 billion, compared to net cash
provided of €3.262 billion in fiscal 2004.
Management’s discussion and analysis
Consolidated Financial Statements Notes to Consolidated Financial Statements
Continuing
Continuing Discontinued and discontinued
operations operations operations
Year ended September 30,
(€ in millions) 2005 2004 2005 2004 2005 2004
Net cash provided by (used in):
Operating activities 4,217 4,704 (1,096) 376 3,121 5,080
Investing activities (5,706) (1,689) (118) (129) (5,824) (1,818)
Net cash provided by (used in)
operating and investing activities (1,489) 3,015 (1,214) 247 (2,703) 3,262