Siemens 2005 Annual Report Download - page 185
Download and view the complete annual report
Please find page 185 of the 2005 Siemens annual report below. You can navigate through the pages in the report by either clicking on the pages listed below, or by using the keyword search tool below to find specific information within the annual report.-
 1
1 -
2
-
3
-
4
-
5
-
6
-
7
-
8
-
9
-
10
-
11
-
12
-
13
-
14
-
15
-
16
-
17
-
18
-
19
-
20
-
21
-
22
-
23
-
24
-
25
-
26
-
27
-
28
-
29
-
30
-
31
-
32
-
33
-
34
-
35
-
36
-
37
-
38
-
39
-
40
-
41
-
42
-
43
-
44
-
45
-
46
-
47
-
48
-
49
-
50
-
51
-
52
-
53
-
54
-
55
-
56
-
57
-
58
-
59
-
60
-
61
-
62
-
63
-
64
-
65
-
66
-
67
-
68
-
69
-
70
-
71
-
72
-
73
-
74
-
75
-
76
-
77
-
78
-
79
-
80
-
81
-
82
-
83
-
84
-
85
-
86
-
87
-
88
-
89
-
90
-
91
-
92
-
93
-
94
-
95
-
96
-
97
-
98
-
99
-
100
-
101
-
102
-
103
-
104
-
105
-
106
-
107
-
108
-
109
-
110
-
111
-
112
-
113
-
114
-
115
-
116
-
117
-
118
-
119
-
120
-
121
-
122
-
123
-
124
-
125
-
126
-
127
-
128
-
129
-
130
-
131
-
132
-
133
-
134
-
135
-
136
-
137
-
138
-
139
-
140
-
141
-
142
-
143
-
144
-
145
-
146
-
147
-
148
-
149
-
150
-
151
-
152
-
153
-
154
-
155
-
156
-
157
-
158
-
159
-
160
-
161
-
162
-
163
-
164
-
165
-
166
-
167
-
168
-
169
-
170
-
171
-
172
-
173
-
174
-
 175
175 -
 176
176 -
 177
177 -
 178
178 -
 179
179 -
 180
180 -
 181
181 -
 182
182 -
 183
183 -
 184
184 -
 185
185 -
 186
186 -
 187
187 -
 188
188 -
 189
189 -
 190
190 -
 191
191 -
 192
192 -
 193
193 -
 194
194 -
 195
195 -
196
-
197
-
198
-
199
-
200
-
201
-
202
-
203
-
204
-
205
-
206
-
207
-
208
-
209
-
210
-
211
-
212
-
213
-
214
-
215
-
216
-
217
-
218
-
219
-
220
-
221
-
222
-
223
-
224
-
225
-
226
-
227
-
228
-
229
-
230
-
231
-
232
 |
 |

185
The measurement dates for the valuation of certain Siemens pension funds, particularly our
funds in the U.S. and U.K., do not coincide with the end of the Company’s fiscal year. While the
actual return over the last twelve months amounted to 12.41% or €2,392 billion, the aggregate
return on plan assets between their respective measurement dates amounted to 11.91% or €2,289
billion. For the domestic pension plans, €1,596 or 11.88% was realized, as compared to an expect-
ed return on plan assets of 6.75% or an amount of €905 that was included in the NPPC. For the
foreign pension plans, €693 or 11.98% was realized, as compared to an expected return on plan
assets of 6.6% or an amount of €386 that was included in the NPPC.
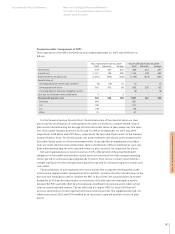
Pension benefits: Plan Assets
The asset allocation of the plan assets of the principal pension benefit plans as of the measure-
ment date for fiscal 2005 and 2004 as well as the target asset allocation for fiscal year 2006, are
as follows:
The asset allocation represents the plan assets exposure to market risk. For example, an equity
instrument whose risk is hedged by a derivative is not reported as equity but under cash. Current
asset allocation is biased towards high quality government and selected corporate bonds.
Siemens constantly reviews the asset allocation in light of the duration of its pension liabilities
and analysis trends and events that may affect asset values in order to initiate appropriate meas-
ures at a very early stage.
Pension benefits: Pension Plan Funding
Contributions made by the Company to its principal pension benefit plans in fiscal 2005 and
2004, as well as those planned in fiscal 2006, are as follows:
Notes to Consolidated Financial Statements
Consolidated Financial Statements Notes to Consolidated Financial Statements
(in millions of €, except where otherwise stated
and per share amounts)
Target asset
allocation Asset allocation as of the measurement date
September September 30, 2005 September 30, 2004
Asset class 30, 2006 Total Domestic Foreign Total Domestic Foreign
Equity 20–50% 31% 25% 43% 26% 18% 44%
Fixed income 40 – 70% 56% 63% 40% 56% 64% 39%
Real estate 5 – 15% 8% 7% 9% 9% 8% 10%
Cash 5– 15% 5% 5% 8% 9% 10% 7%
100% 100% 100% 100% 100% 100%
(Unaudited) Year ended
September 30, 2006 (expected) Year ended September 30, 2005 Year ended September 30, 2004
Total Domestic Foreign Total Domestic Foreign Total Domestic Foreign
Regular funding 611 321 290 535 159 376 518 236 282
Supplemental cash
Contributions – – – 1,496 1,380 116 1,255 700 555
Total 611 321 290 2,031 1,539 492 1,773 936 837