Siemens 2005 Annual Report Download - page 106
Download and view the complete annual report
Please find page 106 of the 2005 Siemens annual report below. You can navigate through the pages in the report by either clicking on the pages listed below, or by using the keyword search tool below to find specific information within the annual report.-
 1
1 -
2
-
3
-
4
-
5
-
6
-
7
-
8
-
9
-
10
-
11
-
12
-
13
-
14
-
15
-
16
-
17
-
18
-
19
-
20
-
21
-
22
-
23
-
24
-
25
-
26
-
27
-
28
-
29
-
30
-
31
-
32
-
33
-
34
-
35
-
36
-
37
-
38
-
39
-
40
-
41
-
42
-
43
-
44
-
45
-
46
-
47
-
48
-
49
-
50
-
51
-
52
-
53
-
54
-
55
-
56
-
57
-
58
-
59
-
60
-
61
-
62
-
63
-
64
-
65
-
66
-
67
-
68
-
69
-
70
-
71
-
72
-
73
-
74
-
75
-
76
-
77
-
78
-
79
-
80
-
81
-
82
-
83
-
84
-
85
-
86
-
87
-
88
-
89
-
90
-
91
-
92
-
93
-
94
-
95
-
 96
96 -
 97
97 -
 98
98 -
 99
99 -
 100
100 -
 101
101 -
 102
102 -
 103
103 -
 104
104 -
 105
105 -
 106
106 -
 107
107 -
 108
108 -
 109
109 -
 110
110 -
 111
111 -
 112
112 -
 113
113 -
 114
114 -
 115
115 -
 116
116 -
117
-
118
-
119
-
120
-
121
-
122
-
123
-
124
-
125
-
126
-
127
-
128
-
129
-
130
-
131
-
132
-
133
-
134
-
135
-
136
-
137
-
138
-
139
-
140
-
141
-
142
-
143
-
144
-
145
-
146
-
147
-
148
-
149
-
150
-
151
-
152
-
153
-
154
-
155
-
156
-
157
-
158
-
159
-
160
-
161
-
162
-
163
-
164
-
165
-
166
-
167
-
168
-
169
-
170
-
171
-
172
-
173
-
174
-
175
-
176
-
177
-
178
-
179
-
180
-
181
-
182
-
183
-
184
-
185
-
186
-
187
-
188
-
189
-
190
-
191
-
192
-
193
-
194
-
195
-
196
-
197
-
198
-
199
-
200
-
201
-
202
-
203
-
204
-
205
-
206
-
207
-
208
-
209
-
210
-
211
-
212
-
213
-
214
-
215
-
216
-
217
-
218
-
219
-
220
-
221
-
222
-
223
-
224
-
225
-
226
-
227
-
228
-
229
-
230
-
231
-
232
 |
 |

106
EVA performance
During fiscal 2005, Siemens continued its enterprise-wide focus on economic value added (EVA).
We tie a significant portion of our executive incentive compensation to achieving EVA targets.
EVA is a financial performance measure of the value created or destroyed by a business. In
simple terms, it compares the earnings of a business (using Group profit for the Operations
Groups and income before income taxes for the Financing and Real Estate businesses as a base)
against the cost of capital employed to run that business. A positive EVA means that a business
has earned more than its cost of capital, whereas a negative EVA means that a business has earned
less than its cost of capital. Depending on the change of EVA between comparable fiscal periods, a
business is defined as value-creating or value-destroying. Consequently, the increase or decrease
of EVA is an important measure of financial performance.
We use this measure of performance in addition to Group profit and income before income
taxes because those measures focus on results without taking into consideration the cost of capi-
tal employed in the business. In this manner, EVA complements Group profit and income before
income taxes. For EVA calculation purposes, data from the consolidated financial statements is
used and to a limited extent adjusted. The most important financial adjustment, representing the
major part of the total EVA adjustment amount within our Operations component, results from
operating lease commitments. We believe that including such financial adjustment in the EVA
measure enhances our business decision-making processes.
As the two major business components of Siemens - Operations compared to Financing and
Real Estate - are fundamentally different from each other, we use two types of EVA calculations:
the industry concept in the case of Operations Groups and the financial concept in the case of
Financing and Real Estate.
In the case of Operations Groups, we use Group profit as the base measure and apply a flat tax
rate for calculating the operating profit after taxes. The cost of capital for each Group is deter-
mined by taking the weighted average of the after-tax cost of debt and equity of Siemens and
applying a risk-based factor which takes into account the specific risk associated with the particu-
lar business.
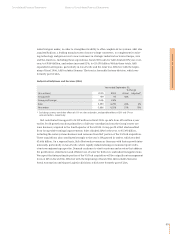
The underlying assumptions of our EVA calculations are continuously reviewed. As a result of
the shift in the market value debt-to-equity ratio together with the sustainable changes in our
business environment - particularly with respect to the interest rate, the market risk and the tax
law - an adaptation of key assumptions for our EVA calculation was initiated at the beginning of
fiscal year 2005. The following table illustrates the current and the former percentages of our cost
of debt, our flat tax rate and our debt-to-equity ratio at a fair value:
Management’s discussion and analysis
EVA performance
Assumptions
new old
Cost of debt 4.7% 5.3%
Flat tax rate 30% 35%
Market value of equity as a percentage of total capital 80% 85%
Market value of debt as a percentage of total capital 20% 15%