Siemens 2005 Annual Report Download - page 144
Download and view the complete annual report
Please find page 144 of the 2005 Siemens annual report below. You can navigate through the pages in the report by either clicking on the pages listed below, or by using the keyword search tool below to find specific information within the annual report.-
 1
1 -
2
-
3
-
4
-
5
-
6
-
7
-
8
-
9
-
10
-
11
-
12
-
13
-
14
-
15
-
16
-
17
-
18
-
19
-
20
-
21
-
22
-
23
-
24
-
25
-
26
-
27
-
28
-
29
-
30
-
31
-
32
-
33
-
34
-
35
-
36
-
37
-
38
-
39
-
40
-
41
-
42
-
43
-
44
-
45
-
46
-
47
-
48
-
49
-
50
-
51
-
52
-
53
-
54
-
55
-
56
-
57
-
58
-
59
-
60
-
61
-
62
-
63
-
64
-
65
-
66
-
67
-
68
-
69
-
70
-
71
-
72
-
73
-
74
-
75
-
76
-
77
-
78
-
79
-
80
-
81
-
82
-
83
-
84
-
85
-
86
-
87
-
88
-
89
-
90
-
91
-
92
-
93
-
94
-
95
-
96
-
97
-
98
-
99
-
100
-
101
-
102
-
103
-
104
-
105
-
106
-
107
-
108
-
109
-
110
-
111
-
112
-
113
-
114
-
115
-
116
-
117
-
118
-
119
-
120
-
121
-
122
-
123
-
124
-
125
-
126
-
127
-
128
-
129
-
130
-
131
-
132
-
133
-
 134
134 -
 135
135 -
 136
136 -
 137
137 -
 138
138 -
 139
139 -
 140
140 -
 141
141 -
 142
142 -
 143
143 -
 144
144 -
 145
145 -
 146
146 -
 147
147 -
 148
148 -
 149
149 -
 150
150 -
 151
151 -
 152
152 -
 153
153 -
 154
154 -
155
-
156
-
157
-
158
-
159
-
160
-
161
-
162
-
163
-
164
-
165
-
166
-
167
-
168
-
169
-
170
-
171
-
172
-
173
-
174
-
175
-
176
-
177
-
178
-
179
-
180
-
181
-
182
-
183
-
184
-
185
-
186
-
187
-
188
-
189
-
190
-
191
-
192
-
193
-
194
-
195
-
196
-
197
-
198
-
199
-
200
-
201
-
202
-
203
-
204
-
205
-
206
-
207
-
208
-
209
-
210
-
211
-
212
-
213
-
214
-
215
-
216
-
217
-
218
-
219
-
220
-
221
-
222
-
223
-
224
-
225
-
226
-
227
-
228
-
229
-
230
-
231
-
232
 |
 |

144
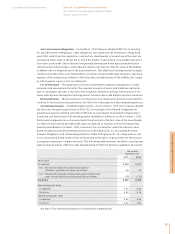
Segment Information (continuing operations)
As of and for the fiscal years ended September 30, 2005 and 2004 (in millions of €)
Management’s discussion and analysis
(1) Group profit of the Operations Groups is earnings before financing interest,
certain pension costs and income taxes.
(2) Net capital employed of the Operations Groups represents total assets less
tax assets, certain accruals and non-interest bearing liabilities other than tax
liabilities.
(3) Intangible assets, property, plant and equipment, acquisitions, and invest-
ments.
(4) Includes amortization and impairments of intangible assets, depreciation of
property, plant and equipment, and write-downs of investments.
(5) The Groups ICN and ICM were combined into one Group named Communi-
cations (Com) as of October 1, 2004.
(6) L&A’s Distribution and Industry Logistics (DI) as well as Material
Handling Products (MHP) divisions were reclassified to Other
Operations as of September 30, 2005. Prior year information was
reclassified for comparability purposes.
(7) Other Operations primarily refer to certain centrally-held equity invest-
ments and other operating activities not associated with a Group.
(8) Includes (for Eliminations within Financing and Real Estate consists
of) cash paid for income taxes according to the allocation of income
taxes to Operations, Financing and Real Estate, and Eliminations,
reclassifications and Corporate Treasury in the Consolidated State-
ments of Income.
Eliminations, reclassifications
and Corporate Treasury (1,621) – – – (1,677) (1,517) (1,677) (1,517)
Siemens 83,791 75,789 75,445 70,237 – – 75,445 70,237
New orders Intersegment
(unaudited) External sales sales Total sales
2005 2004 2005 2004 2005 2004 2005 2004
Operations Groups
Communications (Com)(5) 13,802 13,031 12,823 12,258 318 451 13,141 12,709
Siemens Business Services (SBS) 6,531 6,293 3,964 3,598 1,409 1,118 5,373 4,716
Automation and Drives (A&D) 10,190 8,980 8,537 7,569 1,307 1,260 9,844 8,829
Industrial Solutions and Services (I&S) 5,686 4,356 4,350 3,147 1,040 1,143 5,390 4,290
Logistics and Assembly Systems (L&A)(6) 2,015 1,799 1,386 1,297 86 122 1,472 1,419
Siemens Building Technologies (SBT) 4,518 4,358 4,301 4,174 114 73 4,415 4,247
Power Generation (PG) 10,964 9,243 8,042 7,505 19 22 8,061 7,527
Power Transmission and Distribution (PTD) 5,283 3,863 3,930 3,292 320 319 4,250 3,611
Transportation Systems (TS) 4,599 4,321 4,146 4,284 44 26 4,190 4,310
Siemens VDO Automotive (SV) 9,787 9,029 9,591 8,987 19 14 9,610 9,001
Medical Solutions (Med) 8,641 8,123 7,577 6,969 49 103 7,626 7,072
Osram 4,300 4,240 4,222 4,143 78 97 4,300 4,240
Other Operations(7) 3,236 3,215 1,770 2,050 1,352 1,242 3,122 3,292
Total Operations Groups 89,552 80,851 74,639 69,273 6,155 5,990 80,794 75,263
Reconciliation to financial statements
Corporate items, pensions and eliminations (6,293) (7,202) 77 208 (5,902) (5,844) (5,825) (5,636)
Other interest expense – – – – – – – –
Other assets related and miscellaneous
reconciling items – – – – – – – –
Total Operations (for columns Group
profit/Net capital employed, i.e. Income
before income taxes/Total assets) 83,259 73,649 74,716 69,481 253 146 74,969 69,627
Financing and Real Estate Groups
Siemens Financial Services (SFS) 542 562 464 453 78 109 542 562
Siemens Real Estate (SRE) 1,621 1,578 265 303 1,356 1,275 1,621 1,578
Eliminations (10) – – – (10) (13) (10) (13)
Total Financing and Real Estate 2,153 2,140 729 756 1,424 1,371 2,153 2,127