Siemens 2005 Annual Report Download - page 118
Download and view the complete annual report
Please find page 118 of the 2005 Siemens annual report below. You can navigate through the pages in the report by either clicking on the pages listed below, or by using the keyword search tool below to find specific information within the annual report.-
 1
1 -
2
-
3
-
4
-
5
-
6
-
7
-
8
-
9
-
10
-
11
-
12
-
13
-
14
-
15
-
16
-
17
-
18
-
19
-
20
-
21
-
22
-
23
-
24
-
25
-
26
-
27
-
28
-
29
-
30
-
31
-
32
-
33
-
34
-
35
-
36
-
37
-
38
-
39
-
40
-
41
-
42
-
43
-
44
-
45
-
46
-
47
-
48
-
49
-
50
-
51
-
52
-
53
-
54
-
55
-
56
-
57
-
58
-
59
-
60
-
61
-
62
-
63
-
64
-
65
-
66
-
67
-
68
-
69
-
70
-
71
-
72
-
73
-
74
-
75
-
76
-
77
-
78
-
79
-
80
-
81
-
82
-
83
-
84
-
85
-
86
-
87
-
88
-
89
-
90
-
91
-
92
-
93
-
94
-
95
-
96
-
97
-
98
-
99
-
100
-
101
-
102
-
103
-
104
-
105
-
106
-
107
-
 108
108 -
 109
109 -
 110
110 -
 111
111 -
 112
112 -
 113
113 -
 114
114 -
 115
115 -
 116
116 -
 117
117 -
 118
118 -
 119
119 -
 120
120 -
 121
121 -
 122
122 -
 123
123 -
 124
124 -
 125
125 -
 126
126 -
 127
127 -
 128
128 -
129
-
130
-
131
-
132
-
133
-
134
-
135
-
136
-
137
-
138
-
139
-
140
-
141
-
142
-
143
-
144
-
145
-
146
-
147
-
148
-
149
-
150
-
151
-
152
-
153
-
154
-
155
-
156
-
157
-
158
-
159
-
160
-
161
-
162
-
163
-
164
-
165
-
166
-
167
-
168
-
169
-
170
-
171
-
172
-
173
-
174
-
175
-
176
-
177
-
178
-
179
-
180
-
181
-
182
-
183
-
184
-
185
-
186
-
187
-
188
-
189
-
190
-
191
-
192
-
193
-
194
-
195
-
196
-
197
-
198
-
199
-
200
-
201
-
202
-
203
-
204
-
205
-
206
-
207
-
208
-
209
-
210
-
211
-
212
-
213
-
214
-
215
-
216
-
217
-
218
-
219
-
220
-
221
-
222
-
223
-
224
-
225
-
226
-
227
-
228
-
229
-
230
-
231
-
232
 |
 |

118
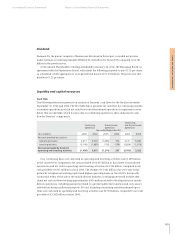
Overview financial position
As of September 30, 2005, total assets increased by €6.687 billion to €86.205 billion compared to
total assets of €79.518 billion as of September 30, 2004. This growth of 8% was mainly due to
major acquisitions in the current year which include: CTI at Med, VA Tech, primarily integrated
into PTD and I&S, and A&D’s acquisition of Flender. Increases in assets from acquisitions more
than offset the sale of assets to BenQ, as part of the mobile devices divestment. The remaining
assets and liabilities for these discontinued operations are classified as held for sale and will be
transferred in fiscal 2006.
Current assets at the respective balance sheet dates were as follows:
Cash and cash equivalents totaled €8.121 billion at September 30, 2005. The decrease of €4.069
billion was primarily due to cash outflows associated with the acquisitions and investments
mentioned above, and supplemental contributions to our pension plans totaling €1.496 billion.
Marketable securities were higher primarily due to the reclassification of Juniper shares from
Long-term investments in fiscal 2005. Due to the sale of Juniper shares in fiscal 2005, additional
shares became available-for-sale securities and accordingly reclassified to short-term. Accounts
receivable, net was €17.122 billion at the end of fiscal 2005 reflecting mainly an increase from the
VA Tech and Flender acquisitions. The increase in Inventories, net of €1.454 billion was driven by
growing business volume as well as acquisitions. Other current assets totaled €5.230 billion at the
end of fiscal 2005 and include VA Tech’s hydropower activities which will be sold to comply with a
European antitrust ruling.
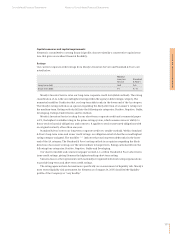
Long-term assets at the respective balance sheet dates were as follows:
Goodwill increased by €2.454 billion, to €8.930 billion at September 30, 2005, attributable
primarily to the major acquisitions of VA Tech, which contributed €1.027 billion, CTI of €525 mil-
lion, and Flender with €452 million. Fiscal 2005 also included goodwill impairments totaling €279
Management’s discussion and analysis
Overview financial position
September 30,
(€ in millions) 2005 2004
Long-term investments 3,768 4,122
Goodwill 8,930 6,476
Other intangible assets, net 3,107 2,514
Property, plant and equipment, net 12,012 10,683
Deferred income taxes 6,321 4,811
Other assets 5,264 4,966
Total long-term assets 39,402 33,572
September 30,
(€ in millions) 2005 2004
Cash and cash equivalents 8,121 12,190
Marketable securities 1,789 1,386
Accounts receivable, net 17,122 15,470
Inventories, net 12,812 11,358
Deferred income taxes 1,484 1,144
Assets held for sale 245 –
Other current assets 5,230 4,398
Total current assets 46,803 45,946