Siemens 2005 Annual Report Download - page 101
Download and view the complete annual report
Please find page 101 of the 2005 Siemens annual report below. You can navigate through the pages in the report by either clicking on the pages listed below, or by using the keyword search tool below to find specific information within the annual report.-
 1
1 -
2
-
3
-
4
-
5
-
6
-
7
-
8
-
9
-
10
-
11
-
12
-
13
-
14
-
15
-
16
-
17
-
18
-
19
-
20
-
21
-
22
-
23
-
24
-
25
-
26
-
27
-
28
-
29
-
30
-
31
-
32
-
33
-
34
-
35
-
36
-
37
-
38
-
39
-
40
-
41
-
42
-
43
-
44
-
45
-
46
-
47
-
48
-
49
-
50
-
51
-
52
-
53
-
54
-
55
-
56
-
57
-
58
-
59
-
60
-
61
-
62
-
63
-
64
-
65
-
66
-
67
-
68
-
69
-
70
-
71
-
72
-
73
-
74
-
75
-
76
-
77
-
78
-
79
-
80
-
81
-
82
-
83
-
84
-
85
-
86
-
87
-
88
-
89
-
90
-
 91
91 -
 92
92 -
 93
93 -
 94
94 -
 95
95 -
 96
96 -
 97
97 -
 98
98 -
 99
99 -
 100
100 -
 101
101 -
 102
102 -
 103
103 -
 104
104 -
 105
105 -
 106
106 -
 107
107 -
 108
108 -
 109
109 -
 110
110 -
 111
111 -
112
-
113
-
114
-
115
-
116
-
117
-
118
-
119
-
120
-
121
-
122
-
123
-
124
-
125
-
126
-
127
-
128
-
129
-
130
-
131
-
132
-
133
-
134
-
135
-
136
-
137
-
138
-
139
-
140
-
141
-
142
-
143
-
144
-
145
-
146
-
147
-
148
-
149
-
150
-
151
-
152
-
153
-
154
-
155
-
156
-
157
-
158
-
159
-
160
-
161
-
162
-
163
-
164
-
165
-
166
-
167
-
168
-
169
-
170
-
171
-
172
-
173
-
174
-
175
-
176
-
177
-
178
-
179
-
180
-
181
-
182
-
183
-
184
-
185
-
186
-
187
-
188
-
189
-
190
-
191
-
192
-
193
-
194
-
195
-
196
-
197
-
198
-
199
-
200
-
201
-
202
-
203
-
204
-
205
-
206
-
207
-
208
-
209
-
210
-
211
-
212
-
213
-
214
-
215
-
216
-
217
-
218
-
219
-
220
-
221
-
222
-
223
-
224
-
225
-
226
-
227
-
228
-
229
-
230
-
231
-
232
 |
 |

101
Power
Power Generation (PG)
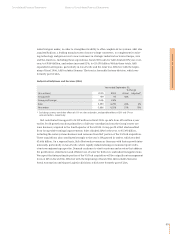
Fiscal 2005 orders climbed 19% at PG, to €10.964 billion for the year, fueled by PG’s integration
of Bonus, a wind power business acquired in the first quarter, and large fossil power plant con-
tracts in the Middle East, Europe, Germany and the Commonwealth of Independent States (C.I.S.).
The Group’s 7% increase in sales, to €8.061 billion, also benefited from the Bonus acquisition.
The wind power sector is growing at double-digit rates, primarily from demand in developed
nations. Sales growth was complemented by the industrial applications business. PG delivered
€951 million in Group profit in fiscal 2005, close to the level a year earlier. Cancellation gains
were €58 million compared to €47 million a year earlier. Group profit contributions from joint
ventures were higher than in the prior year, including continued earnings from PG’s joint venture
Framatome in Europe and first-time contributions from PG’s joint ventures in China. The Group’s
earnings margin was negatively impacted by ongoing changes in sales mix, including faster
growth in PG’s industrial business relative to its fossil power generation business.
Power Transmission and Distribution (PTD)
PTD delivered €212 million in Group profit in fiscal 2005, after integration costs related to its
portion of Siemens’ VA Tech acquisition, charges related to a project in the C.I.S., and charges for
capacity adjustments at a transformer facility in Germany. Sales and orders benefited from
Siemens’ acquisition of VA Tech, the majority of which was allocated to PTD, and full-year results
from Trench Electric Holding, acquired late in the prior year and integrated in fiscal 2005. Sales
increased 18%, to €4.250 billion, and orders surged 37%, to €5.283 billion, also on the strength
of Group-wide growth, particularly in the High Voltage division. These acquisitions add capacity
to PTD at a time of rising demand for long-distance, low-loss power transmission, particularly
in China. We expect that integrating its portion of the VA Tech acquisition will be a significant
management focus at PTD in fiscal 2006.
Management’s discussion and analysis
Consolidated Financial Statements Notes to Consolidated Financial Statements
Year ended September 30,
% Change
(€ in millions) 2005 2004 Actual Adjusted*
Group profit 951 961 (1)%
Group profit margin 11.8% 12.8%
Sales 8,061 7,527 7% 3%
New orders 10,964 9,243 19% 14%
* Excluding currency translation effects of (1)% on sales and orders, and portfolio effects of 5% and 6% on sales
and orders, respectively.
Year ended September 30,
% Change
(€ in millions) 2005 2004 Actual Adjusted*
Group profit 212 238 (11)%
Group profit margin 5.0% 6.6%
Sales 4,250 3,611 18% 3%
New orders 5,283 3,863 37% 26%
* Excluding currency translation effects of (1)% on orders, and portfolio effects of 15% and 12% on sales and
orders, respectively.