Siemens 2005 Annual Report Download - page 119
Download and view the complete annual report
Please find page 119 of the 2005 Siemens annual report below. You can navigate through the pages in the report by either clicking on the pages listed below, or by using the keyword search tool below to find specific information within the annual report.-
 1
1 -
2
-
3
-
4
-
5
-
6
-
7
-
8
-
9
-
10
-
11
-
12
-
13
-
14
-
15
-
16
-
17
-
18
-
19
-
20
-
21
-
22
-
23
-
24
-
25
-
26
-
27
-
28
-
29
-
30
-
31
-
32
-
33
-
34
-
35
-
36
-
37
-
38
-
39
-
40
-
41
-
42
-
43
-
44
-
45
-
46
-
47
-
48
-
49
-
50
-
51
-
52
-
53
-
54
-
55
-
56
-
57
-
58
-
59
-
60
-
61
-
62
-
63
-
64
-
65
-
66
-
67
-
68
-
69
-
70
-
71
-
72
-
73
-
74
-
75
-
76
-
77
-
78
-
79
-
80
-
81
-
82
-
83
-
84
-
85
-
86
-
87
-
88
-
89
-
90
-
91
-
92
-
93
-
94
-
95
-
96
-
97
-
98
-
99
-
100
-
101
-
102
-
103
-
104
-
105
-
106
-
107
-
108
-
 109
109 -
 110
110 -
 111
111 -
 112
112 -
 113
113 -
 114
114 -
 115
115 -
 116
116 -
 117
117 -
 118
118 -
 119
119 -
 120
120 -
 121
121 -
 122
122 -
 123
123 -
 124
124 -
 125
125 -
 126
126 -
 127
127 -
 128
128 -
 129
129 -
130
-
131
-
132
-
133
-
134
-
135
-
136
-
137
-
138
-
139
-
140
-
141
-
142
-
143
-
144
-
145
-
146
-
147
-
148
-
149
-
150
-
151
-
152
-
153
-
154
-
155
-
156
-
157
-
158
-
159
-
160
-
161
-
162
-
163
-
164
-
165
-
166
-
167
-
168
-
169
-
170
-
171
-
172
-
173
-
174
-
175
-
176
-
177
-
178
-
179
-
180
-
181
-
182
-
183
-
184
-
185
-
186
-
187
-
188
-
189
-
190
-
191
-
192
-
193
-
194
-
195
-
196
-
197
-
198
-
199
-
200
-
201
-
202
-
203
-
204
-
205
-
206
-
207
-
208
-
209
-
210
-
211
-
212
-
213
-
214
-
215
-
216
-
217
-
218
-
219
-
220
-
221
-
222
-
223
-
224
-
225
-
226
-
227
-
228
-
229
-
230
-
231
-
232
 |
 |

119
million, including €262 million related to SBS. Higher Other intangible assets also were impacted
by the above acquisitions. Property, plant and equipment, net rose by €1.329 billion, to €12.012
billion, reflecting both capital investments for future growth and acquisitions.
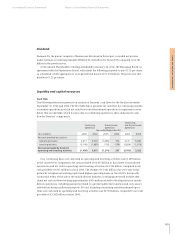
Current and long-term liabilities at the respective balance sheet dates were as follows:
Short-term debt and current maturities of long-term debt totaled €3.999 billion, an increase of
€2.565 billion from the prior year-end. This increase mainly resulted from our 5.0% 2001/2006
euro bonds becoming current which were reported in Long-term debt in fiscal 2004. The current
year amount also includes the issuance of commercial paper as well as repayments of notes
exchangeable into Infineon shares which came due in fiscal 2005. An Accounts payable increase
of €845 million, to €10.171 billion, was mainly driven by the acquisitions in fiscal 2005. Other cur-
rent liabilities of €13.267 billion include billings on long-term construction contracts and payroll
related liabilities. The increase year-over-year also related to acquisitions in fiscal 2005. The
increase of €525 million in Pension plans and similar commitments is primarily the result of a
higher additional minimum liability and funding, as well as the effect from a lower discount rate
at September 30, 2005. Accrued liabilities rose by €929 million, to €10.169 billion, principally due
to increased employee related costs and tax liabilities.
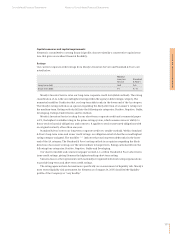
Shareholders’ equity and total assets were as follows:
Total shareholders’ equity rose €262 million, to €27.117 billion at the end of fiscal 2005. The
increase results from net income of €2.248 billion, less dividend payments of €1.112 billion and
changes in other comprehensive income of negative €919 million in fiscal 2005. These changes
were significantly impacted by the change in the minimum pension liability. Due to the overall
increase in total assets, the equity ratio decreased by 3 percentage points, to 31%.
For additional information, see “Notes to Consolidated Financial Statements.”
Management’s discussion and analysis
Consolidated Financial Statements Notes to Consolidated Financial Statements
September 30,
(€ in millions) 2005 2004
Short-term debt and current maturities of long-term debt 3,999 1,434
Accounts payable 10,171 9,326
Accrued liabilities 10,169 9,240
Deferred income taxes 1,938 1,522
Liabilities held for sale 289 –
Other current liabilities 13,267 11,850
Total current liabilities 39,833 33,372
Long-term debt 8,436 9,785
Pension plans and similar commitments 4,917 4,392
Deferred income taxes 427 569
Other accruals and provisions 4,819 4,016
Total long-term liabilities 18,599 18,762
September 30,
(€ in millions) 2005 2004
Total shareholders’ equity 27,117 26,855
Equity ratio 31% 34%
Total assets 86,205 79,518