Sony 2002 Annual Report Download - page 22
Download and view the complete annual report
Please find page 22 of the 2002 Sony annual report below. You can navigate through the pages in the report by either clicking on the pages listed below, or by using the keyword search tool below to find specific information within the annual report.-
 1
1 -
2
-
3
-
4
-
5
-
6
-
7
-
8
-
9
-
10
-
11
-
 12
12 -
 13
13 -
 14
14 -
 15
15 -
 16
16 -
 17
17 -
 18
18 -
 19
19 -
 20
20 -
 21
21 -
 22
22 -
 23
23 -
 24
24 -
 25
25 -
 26
26 -
 27
27 -
 28
28 -
 29
29 -
 30
30 -
 31
31 -
 32
32 -
33
-
34
-
35
-
36
-
37
-
38
-
39
-
40
-
41
-
42
-
43
-
44
-
45
-
46
-
47
-
48
-
49
-
50
-
51
-
52
-
53
-
54
-
55
-
56
-
57
-
58
-
59
-
60
-
61
-
62
-
63
-
64
-
65
-
66
-
67
-
68
-
69
-
70
-
71
-
72
-
73
-
74
-
75
-
76
-
77
-
78
-
79
-
80
-
81
-
82
-
83
-
84
 |
 |

20
Sony Corporation Annual Report 2002
02
01
00
5,310
99
4,671
247
5,473
-8
02
01
00
1,004
77
655
-51
661
83
02
01
00
643
28
707
21
612
20
02
01
00
636
36
495
4
555
31
02
01
00
512
23
439
17
479
22
02
01
00
146
-10
142
-9
156
-9
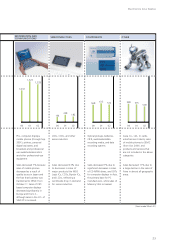
FINANCIAL
SERVICES
ELECTRONICS
Electronics business consists of
Audio, Video, Televisions,
Information and communica-
tions, Semiconductors,
Components and other.
SALES AND REVENUE, OPERATING INCOME (Billion ¥)BUSINESS AREAS
The Other segment includes
location-based entertainment
businesses, Internet-related
business (So-net) conducted by
Sony Communication Network
Corporation, advertising agency
business and other businesses.
The Financial Services segment
includes Sony Life Insurance
Co., Ltd., Sony Assurance Inc.,
Sony Finance International, Inc.
and Sony Bank Inc.
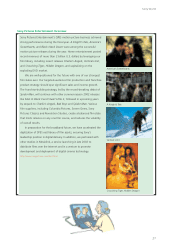
Motion picture and television
business is conducted mainly
through Sony Pictures
Entertainment Inc. (SPE).
Music business is conducted
mainly through Sony Music
Entertainment Inc. (SMEI) and
Sony Music Entertainment
(Japan) Inc. (SMEJ).
Game console and software
business is conducted mainly
through Sony Computer
Entertainment Inc.
(Years ended March 31)
At a Glance
OTHER
PICTURES
MUSIC
GAME
■ Sales ■ Operating Income
■ Sales ■ Operating Income
■ Sales ■ Operating Income
■ Sales ■ Operating Income
■ Financial Services Revenue
■ Operating Income
■ Sales ■ Operating Income
http://www.sony.co.jp/en/
http://global.scei.co.jp/
http://usa.sonymusic.com/international.html
http://www.sonypictures.com/start.html