Sony 2002 Annual Report Download - page 77
Download and view the complete annual report
Please find page 77 of the 2002 Sony annual report below. You can navigate through the pages in the report by either clicking on the pages listed below, or by using the keyword search tool below to find specific information within the annual report.-
 1
1 -
2
-
3
-
4
-
5
-
6
-
7
-
8
-
9
-
10
-
11
-
12
-
13
-
14
-
15
-
16
-
17
-
18
-
19
-
20
-
21
-
22
-
23
-
24
-
25
-
26
-
27
-
28
-
29
-
30
-
31
-
32
-
33
-
34
-
35
-
36
-
37
-
38
-
39
-
40
-
41
-
42
-
43
-
44
-
45
-
46
-
47
-
48
-
49
-
50
-
51
-
52
-
53
-
54
-
55
-
56
-
57
-
58
-
59
-
60
-
61
-
62
-
63
-
64
-
65
-
66
-
 67
67 -
 68
68 -
 69
69 -
 70
70 -
 71
71 -
 72
72 -
 73
73 -
 74
74 -
 75
75 -
 76
76 -
 77
77 -
 78
78 -
 79
79 -
 80
80 -
 81
81 -
 82
82 -
 83
83 -
 84
84
 |
 |
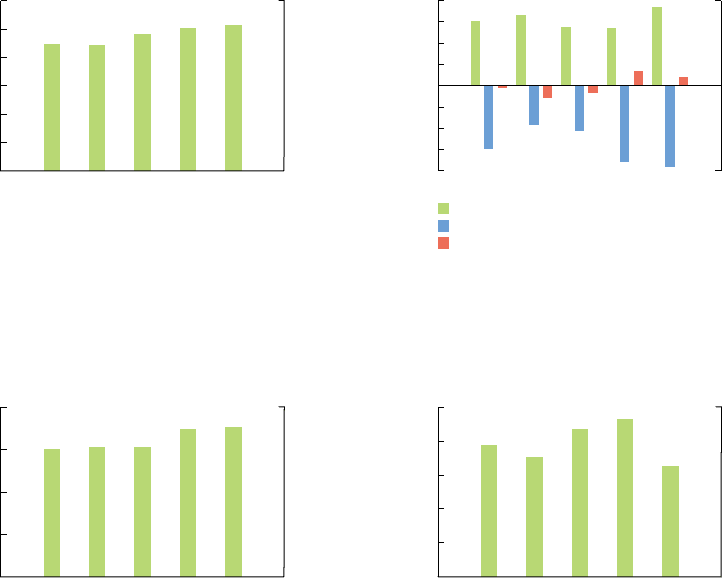
75
98 99 00 01 02
0
500
1,000
1,500
2,000
2,500
3,000
Stockholders’ equity per share Cash flows
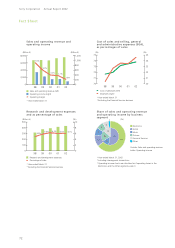
Depreciation and amortization Capital expenditures
(additions to fixed assets on the
balance sheets)
-800
-600
-400
-200
0
200
400
600
800
98 99 00 01 02
98 99 00 01 02
0
100
200
300
400
500
98 99 00 01 02
0
100
200
300
400
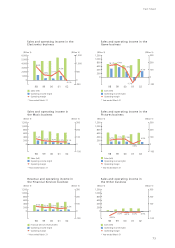
*Year ended March 31
(Billion ¥) (Billion ¥)
(¥) (Billion ¥)
*As of March 31
*Restated to reflect the two-for-one stock split effective
May 19, 2000
Cash flows from operating activities
Cash flows from investing activities
Cash flows from financing activities
*Year ended March 31
*Year ended March 31
*Including amortization expenses for intangible assets and for
deferred insurance acquisition costs
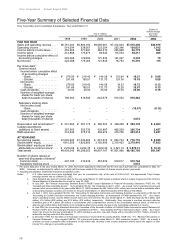
Fact Sheet