Sony 2002 Annual Report Download - page 74
Download and view the complete annual report
Please find page 74 of the 2002 Sony annual report below. You can navigate through the pages in the report by either clicking on the pages listed below, or by using the keyword search tool below to find specific information within the annual report.-
 1
1 -
2
-
3
-
4
-
5
-
6
-
7
-
8
-
9
-
10
-
11
-
12
-
13
-
14
-
15
-
16
-
17
-
18
-
19
-
20
-
21
-
22
-
23
-
24
-
25
-
26
-
27
-
28
-
29
-
30
-
31
-
32
-
33
-
34
-
35
-
36
-
37
-
38
-
39
-
40
-
41
-
42
-
43
-
44
-
45
-
46
-
47
-
48
-
49
-
50
-
51
-
52
-
53
-
54
-
55
-
56
-
57
-
58
-
59
-
60
-
61
-
62
-
63
-
 64
64 -
 65
65 -
 66
66 -
 67
67 -
 68
68 -
 69
69 -
 70
70 -
 71
71 -
 72
72 -
 73
73 -
 74
74 -
 75
75 -
 76
76 -
 77
77 -
 78
78 -
 79
79 -
 80
80 -
 81
81 -
 82
82 -
 83
83 -
 84
84
 |
 |

72
Sony Corporation Annual Report 2002
Fact Sheet
0
2,000
4,000
6,000
8,000
0
200
400
600
800
1,000
1,200
98 99 00 01 02
1.8%
3.1%
3.3%
5.0%
7.6%
98 99 00 01 02
70
71
72
73
74
75
20
21
22
23
24
25
0
100
200
300
400
500
98 99 00 01 02
0
2
4
6
8
10
6.1%
6.1%
6.3%
5.8%
4.9%
64
12
8
8
6
2
53
13
20
14
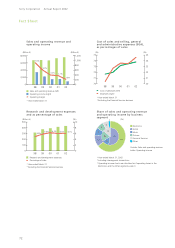
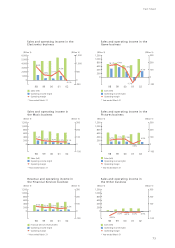
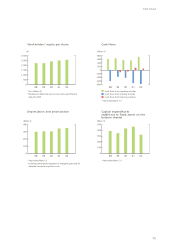
Share of sales and operating revenue
and operating income by business
segment
Electronics
Game
Music
Pictures
Financial Services
Other
Outside: Sales and operating revenue
Inside: Operating income
* Year ended March 31, 2002
* Including intersegment transactions
* Operating income charts are calculated as if operating losses in the
Electronics and the Other segments were 0.
Sales and operating revenue and
operating income
Cost of sales and selling, general
and administrative expenses (SGA),
as percentages of sales
Research and development expenses
and as percentage of sales
(%)
(Billion ¥) (Billion ¥)
Sales and operating revenue (left)
Operating income (right)
Operating margin
* Year ended March 31
Cost of sales/sales (left)
SGA/sales (right)
* Year ended March 31
* Excluding the Financial Services business
(%) (%)
Research and development expenses
Percentage of sales
* Year ended March 31
* Excluding the Financial Services business
(Billion ¥) (%)