Sony 2002 Annual Report Download - page 78
Download and view the complete annual report
Please find page 78 of the 2002 Sony annual report below. You can navigate through the pages in the report by either clicking on the pages listed below, or by using the keyword search tool below to find specific information within the annual report.-
 1
1 -
2
-
3
-
4
-
5
-
6
-
7
-
8
-
9
-
10
-
11
-
12
-
13
-
14
-
15
-
16
-
17
-
18
-
19
-
20
-
21
-
22
-
23
-
24
-
25
-
26
-
27
-
28
-
29
-
30
-
31
-
32
-
33
-
34
-
35
-
36
-
37
-
38
-
39
-
40
-
41
-
42
-
43
-
44
-
45
-
46
-
47
-
48
-
49
-
50
-
51
-
52
-
53
-
54
-
55
-
56
-
57
-
58
-
59
-
60
-
61
-
62
-
63
-
64
-
65
-
66
-
67
-
 68
68 -
 69
69 -
 70
70 -
 71
71 -
 72
72 -
 73
73 -
 74
74 -
 75
75 -
 76
76 -
 77
77 -
 78
78 -
 79
79 -
 80
80 -
 81
81 -
 82
82 -
 83
83 -
 84
84
 |
 |

76
Sony Corporation Annual Report 2002
19991998 2000 2001 2002
200
100
0
0
5,000
10,000
15,000
20,000
25,000
(Year ended March 31)
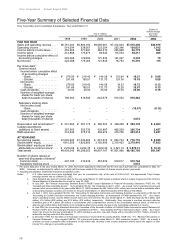
1998 1999 2000 2001 2002
Stock Price (¥)
At year-end 5,650 5,475 14,500 8,900 6,700
High 6,350 6,745 16,950 15,100 10,340
Low 4,260 3,615 5,360 7,510 3,960
Annual Increase/Decrease + 30.6% - 3.1% + 164.8% - 38.6% - 24.7%
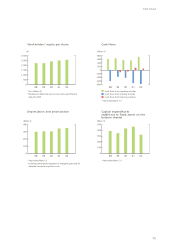
Number of Shares Issued at Year-end
(thousands of shares) 407,195 410,439 453,639 919,617 922,816
Market Capitalization at Year-end (trillion ¥) 4.60 4.49 13.16 8.18 6.18
Per Share Data (¥)
Cash Dividends Applicable to the Year 30.0 25.0 25.0 25.0 25.0
Net Income (Diluted) 241.68 195.51 131.70 19.28 16.67
Stockholders’ Equity 2,230.69 2,224.35 2,409.36 2,521.19 2,570.31
Notes: 1. Stock Prices are based on Tokyo Stock Exchange trading
2. Stock Prices and Cash Dividends have been adjusted to reflect the two-for-one stock split completed on May 19, 2000
Stock Information
2000 2001 2002
Number of Number of Number of Number of Number of Number of
Shares Held Shareholders Shares Held Shareholders Shares Held Shareholders
Foreign Institutions and Individuals 202,139,192 1,617 364,695,373 1,753 356,678,842 1,667
Japanese Financial Institutions 131,467,620 425 270,007,301 551 260,533,688 485
Japanese Individuals and Others 84,734,859 346,044 216,415,427 609,821 253,033,597 717,141
Other Japanese Corporations 31,674,049 4,180 55,029,317 5,666 47,924,895 5,755
Japanese Securities Firms 3,623,543 70 13,469,716 97 4,650,333 76
Total 453,639,163 352,336 919,617,134 617,888 922,816,355 725,124
OWNERSHIP AND DISTRIBUTION OF SHARES (Year ended March 31)
2000
2001
2002
44.5%
39.6%
38.7%
29.0%
29.4%
28.2%
18.7%
23.5%
27.4%
7.0%
6.0%
5.2%
0.8%
1.5%
0.5%
STOCK PRICE RANGE AND TRADING VOLUME ON THE TOKYO STOCK EXCHANGE (Year ended March 31)
Notes: 1. Monthly stock prices (high and low) and trading volume are based on Tokyo Stock Exchange trading
2. Nikkei Average is based on a simple average of monthly closing prices
3. Stock prices (high and low) have been adjusted to reflect the two-for-one stock split completed on May 19, 2000
Japanese
Securities Firms
Other
Japanese
Corporations
Japanese Individuals
and OthersJapanese Financial InstitutionsForeign Institutions and Individuals
Trading Volume
(million shares)
Stock Price and
Nikkei Average
(¥)
Nikkei Average