Sony 2002 Annual Report Download - page 73
Download and view the complete annual report
Please find page 73 of the 2002 Sony annual report below. You can navigate through the pages in the report by either clicking on the pages listed below, or by using the keyword search tool below to find specific information within the annual report.-
 1
1 -
2
-
3
-
4
-
5
-
6
-
7
-
8
-
9
-
10
-
11
-
12
-
13
-
14
-
15
-
16
-
17
-
18
-
19
-
20
-
21
-
22
-
23
-
24
-
25
-
26
-
27
-
28
-
29
-
30
-
31
-
32
-
33
-
34
-
35
-
36
-
37
-
38
-
39
-
40
-
41
-
42
-
43
-
44
-
45
-
46
-
47
-
48
-
49
-
50
-
51
-
52
-
53
-
54
-
55
-
56
-
57
-
58
-
59
-
60
-
61
-
62
-
 63
63 -
 64
64 -
 65
65 -
 66
66 -
 67
67 -
 68
68 -
 69
69 -
 70
70 -
 71
71 -
 72
72 -
 73
73 -
 74
74 -
 75
75 -
 76
76 -
 77
77 -
 78
78 -
 79
79 -
 80
80 -
 81
81 -
 82
82 -
 83
83 -
84
 |
 |

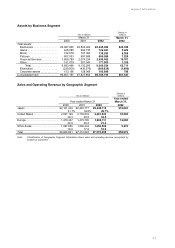
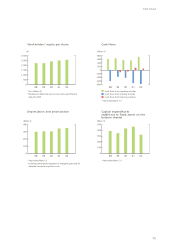
Assets by Business Segment
Yen in millions
Dollars in
millions
March 31
March 31,
2000 2001
2002 2002
Total assets:
Electronics . . . . . . . . . . . . . . . . ¥3,067,835 ¥3,524,209 ¥3,245,009 $24,399
Game . . . . . . . . . . . . . . . . . . . . 446,085 690,737 722,021 5,429
Music . . . . . . . . . . . . . . . . . . . . 742,678 747,360 739,283 5,558
Pictures . . . . . . . . . . . . . . . . . . 807,033 887,806 960,266 7,220
Financial Services . . . . . . . . . . . 1,668,789 2,074,234 2,496,052 18,767
Other . . . . . . . . . . . . . . . . . . . . 151,079 207,947 177,903 1,338
Total . . . . . . . . . . . . . . . . . 6,883,499 8,132,293 8,340,534 62,711
Elimination . . . . . . . . . . . . . . . . (229,500) (432,376) (260,638) (1,960)
Corporate assets . . . . . . . . . . . . 153,198 128,049 105,899 796
Consolidated total . . . . . . . . . . . . . ¥6,807,197 ¥7,827,966 ¥8,185,795 $61,547
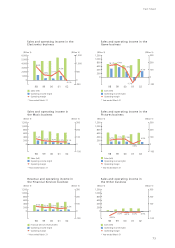
Sales and Operating Revenue by Geographic Segment
Yen in millions Dollars in
millions
Year ended March 31
Year ended
March 31,
2000 2001 2002 2002
Japan . . . . . . . . . . . . . . . . . . . . . . . ¥2,121,249 ¥2,400,777 ¥2,248,115 $16,903
31.7% 32.8% 29.7%
United States . . . . . . . . . . . . . . . . . 2,027,129 2,179,833 2,461,523 18,508
30.3 29.8 32.5
Europe . . . . . . . . . . . . . . . . . . . . . . 1,470,447 1,473,780 1,609,111 12,098
22.0 20.2 21.2
Other Areas . . . . . . . . . . . . . . . . . . 1,067,836 1,260,434 1,259,509 9,470
16.0 17.2 16.6
Total . . . . . . . . . . . . . . . . . . . . . . . . ¥6,686,661 ¥7,314,824 ¥7,578,258 $56,979
Note: Classification of Geographic Segment Information shows sales and operating revenue recognized by
location of customers
Segment Information
71