Sony 2002 Annual Report Download - page 70
Download and view the complete annual report
Please find page 70 of the 2002 Sony annual report below. You can navigate through the pages in the report by either clicking on the pages listed below, or by using the keyword search tool below to find specific information within the annual report.-
 1
1 -
2
-
3
-
4
-
5
-
6
-
7
-
8
-
9
-
10
-
11
-
12
-
13
-
14
-
15
-
16
-
17
-
18
-
19
-
20
-
21
-
22
-
23
-
24
-
25
-
26
-
27
-
28
-
29
-
30
-
31
-
32
-
33
-
34
-
35
-
36
-
37
-
38
-
39
-
40
-
41
-
42
-
43
-
44
-
45
-
46
-
47
-
48
-
49
-
50
-
51
-
52
-
53
-
54
-
55
-
56
-
57
-
58
-
59
-
 60
60 -
 61
61 -
 62
62 -
 63
63 -
 64
64 -
 65
65 -
 66
66 -
 67
67 -
 68
68 -
 69
69 -
 70
70 -
 71
71 -
 72
72 -
 73
73 -
 74
74 -
 75
75 -
 76
76 -
 77
77 -
 78
78 -
 79
79 -
 80
80 -
81
-
82
-
83
-
84
 |
 |

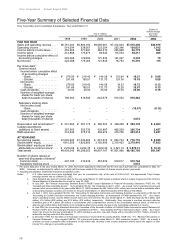
Five-Year Summary of Selected Financial Data
Sony Corporation and Consolidated Subsidiaries - Year ended March 31
Yen in millions
except per share amounts
Dollars in
millions except
per share
amounts
1998 1999 2000 2001 2002 2002
FOR THE YEAR
Sales and operating revenue . . . . ¥6,761,004 ¥6,804,182 ¥6,686,661 ¥7,314,824 ¥7,578,258 $56,979
Operating income . . . . . . . . . . . . . 514,094 338,061 223,204 225,346 134,631 1,012
Income before income taxes . . . . . 459,263 377,691 264,310 265,868 92,775 698
Income taxes . . . . . . . . . . . . . . . . . 214,868 176,973 94,644 115,534 65,211 490
Income before cumulative effect of
accounting changes . . . . . . . . . . 222,068 179,004 121,835 121,227 9,332 70
Net income . . . . . . . . . . . . . . . . . . . 222,068 179,004 121,835 16,754 15,310 115
Per share data*:
Common stock
Income before cumulative effect
of accounting changes
-Basic . . . . . . . . . . . . . . . . . . ¥ 278.85 ¥ 218.43 ¥ 144.58 ¥7,3132.64 ¥ 10.21 $ 0.08
-Diluted . . . . . . . . . . . . . . . . . 241.68 195.51 131.70 124.36 10.18 0.08
Net income
-Basic . . . . . . . . . . . . . . . . . . 278.85 218.43 144.58 18.33 16.72 0.13
-Diluted . . . . . . . . . . . . . . . . . 241.68 195.51 131.70 19.28 16.67 0.13
Cash dividends . . . . . . . . . . . . . 30.00 25.00 25.00 25.00 25.00 0.19
Number of weighted-average
shares for basic per share
data (thousands of shares) 796,363 819,506 842,679 913,932
918,462
Subsidiary tracking stock
Net income (loss)
-Basic . . . . . . . . . . . . . . . . . . – – – – (15.87) (0.12)
Cash dividends . . . . . . . . . . . . . – – – – – –
Number of weighted-average
shares for basic per share
data (thousands of shares) – – – –
3,072
Depreciation and amortization** . . ¥ 301,665 ¥ 307,173 ¥ 306,505 ¥7,348,268 ¥7,354,135 $ 2,663
Capital expenditures
(additions to fixed assets) . . . . . 387,955 353,730 435,887 465,209 326,734 2,457
R&D expenses . . . . . . . . . . . . . . . . 318,044 375,314 394,479 416,708 433,214 3,257
AT YEAR-END
Net working capital . . . . . . . . . . . . ¥1,045,943 ¥1,030,463 ¥6,861,674 ¥7,830,734 ¥7,778,716 $ 5,855
Stockholders’ equity . . . . . . . . . . . 1,815,555 1,823,665 2,182,906 2,315,453 2,370,410 17,823
Stockholders’ equity per share
attributable to common stock* . . . ¥ 2,230.69 ¥ 2,224.35 ¥ 2,409.36 ¥72,521.19 ¥72,570.31 $ 19.33
Total assets . . . . . . . . . . . . . . . . . . ¥6,403,043 ¥6,299,053 ¥6,807,197 ¥7,827,966 ¥8,185,795 $61,547
Number of shares issued at
year-end (thousands of shares)*
Common stock . . . . . . . . . . . . . . 407,195 410,439 453,639 919,617 919,744
Subsidiary tracking stock . . . . . . – – – – 3,072
* Per share data prior to the year ended March 31, 2001 have been adjusted to reflect the two-for-one stock split that was completed on May 19,
2000. However, no adjustment to reflect such stock split has been made to the number of shares issued at prior year-ends.
** Including amortization of deferred insurance acquisition costs.
Notes: 1. U.S. dollar amounts have been translated from yen, for convenience only, at the rate of ¥133=U.S.$1, the approximate Tokyo foreign
exchange market rate as of March 29, 2002.
2. Cash dividends per share of common stock for the year ended March 31, 2002 include a dividend which is subject to approval of the Ordinary
General Meeting of Shareholders to be held on June 20, 2002.
3. In July 2001, the Financial Accounting Standard Board (“FASB”) issued Statement of Financial Accounting Standards (“FAS”) No. 142
“Goodwill and Other Intangible Assets”. Sony adopted FAS No. 142 retroactive to April 1, 2001. As a result, Sony’s operating income and
income before income taxes for the year ended March 31, 2002 increased by ¥20.1 billion ($151 million) and income before cumulative effect
of accounting changes as well as net income for the year ended March 31, 2002 increased by ¥18.9 billion ($142 million).
4. On April 1, 2001, Sony adopted FAS No.133, “Accounting for Derivative Instruments and Hedging Activities” as amended by FAS No.138
“Accounting for Certain Derivative Instruments and Certain Hedging Activities - an Amendment of FASB statement No.133”. As a result,
Sony’s operating income, income before income taxes and net income for the year ended March 31, 2002 decreased by ¥3.0 billion ($23
million), ¥3.4 billion ($26 million) and ¥2.2 billion ($16 million), respectively. Additionally, Sony recorded a one-time non-cash after-tax
unrealized gain of ¥1.1 billion ($8 million) in accumulated other comprehensive income in the consolidated balance sheet, as well as an
after-tax gain of ¥6.0 billion ($45 million) in the cumulative effect of accounting changes in the consolidated statement of income.
5. In June 2000, the Accounting Standards Executive Committee of the American Institute of Certified Public Accountants issued Statement of
Position (“SOP”) 00-2, “Accounting by Producers or Distributors of Films”. Sony adopted SOP 00-2 retroactive to April 1, 2000. As a result,
Sony’s net income for the year ended March 31, 2001 included a one-time, non-cash charge with no tax effect of ¥101.7 billion, primarily to
reduce the carrying value of its film inventory.
6. In December 1999, the Securities and Exchange Commission issued Staff Accounting Bulletin (“SAB”) No. 101, “Revenue Recognition in
Financial Statements”. Sony adopted SAB No. 101 in the fourth quarter ended March 31, 2001 retroactive to April 1, 2000. As a result, a
one-time non-cash cumulative effect adjustment of ¥2.8 billion was recorded in the income statement directly above the caption of “Net
income” for a change in accounting principle.
68
Sony Corporation Annual Report 2002