Sony 2002 Annual Report Download - page 72
Download and view the complete annual report
Please find page 72 of the 2002 Sony annual report below. You can navigate through the pages in the report by either clicking on the pages listed below, or by using the keyword search tool below to find specific information within the annual report.-
 1
1 -
2
-
3
-
4
-
5
-
6
-
7
-
8
-
9
-
10
-
11
-
12
-
13
-
14
-
15
-
16
-
17
-
18
-
19
-
20
-
21
-
22
-
23
-
24
-
25
-
26
-
27
-
28
-
29
-
30
-
31
-
32
-
33
-
34
-
35
-
36
-
37
-
38
-
39
-
40
-
41
-
42
-
43
-
44
-
45
-
46
-
47
-
48
-
49
-
50
-
51
-
52
-
53
-
54
-
55
-
56
-
57
-
58
-
59
-
60
-
61
-
 62
62 -
 63
63 -
 64
64 -
 65
65 -
 66
66 -
 67
67 -
 68
68 -
 69
69 -
 70
70 -
 71
71 -
 72
72 -
 73
73 -
 74
74 -
 75
75 -
 76
76 -
 77
77 -
 78
78 -
 79
79 -
 80
80 -
 81
81 -
 82
82 -
83
-
84
 |
 |

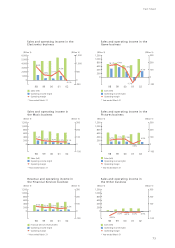
Profit or Loss by Business Segment
Yen in millions
Dollars in
millions
Year ended March 31
Year ended
March 31,
2000 2001
2002 2002
Operating income (loss):
Electronics . . . . . . . . . . . . . . . . . ¥ 98,573 ¥ 247,083 ¥ (8,237) $ (62)
Game . . . . . . . . . . . . . . . . . . . . . 76,935 (51,118) 82,915 623
Music . . . . . . . . . . . . . . . . . . . . . 28,293 20,502 20,175 152
Pictures . . . . . . . . . . . . . . . . . . . 35,920 4,315 31,266 235
Financial Services . . . . . . . . . . . 23,309 17,432 22,134 166
Other . . . . . . . . . . . . . . . . . . . . . (9,648) (9,374) (8,584) (64)
Total . . . . . . . . . . . . . . . . . . 253,382 228,840 139,669 1,050
Elimination . . . . . . . . . . . . . . . . . 10,520 13,503 16,207 122
Unallocated amounts:
Corporate expenses . . . . . . . (40,698) (16,997) (21,245)
(160)
Consolidated operating income . . 223,204 225,346 134,631 1,012
Other income . . . . . . . . . . . . . . . . . 146,299 167,654 96,328 724
Other expenses . . . . . . . . . . . . . . . (105,193) (127,132) (138,184) (1,038)
Consolidated income before
income taxes . . . . . . . . . . . . . . . ¥ 264,310 ¥ 265,868 ¥ 92,775 $
698
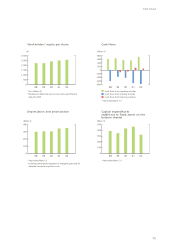
Other Significant Items by Business Segment
Yen in millions
Dollars in
millions
Year ended March 31
Year ended
March 31,
2000 2001
2002 2002
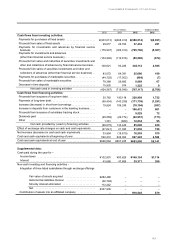
Depreciation and amortization:
Electronics . . . . . . . . . . . . . . . . . ¥212,097 ¥212,728 ¥215,128 $1,618
Game . . . . . . . . . . . . . . . . . . . . 13,414 37,497 49,655 373
Music . . . . . . . . . . . . . . . . . . . . 32,807 34,648 34,835 262
Pictures . . . . . . . . . . . . . . . . . . 10,599 11,853 10,619 80
Financial Services, including
deferred insurance acquisition
costs . . . . . . . . . . . . . . . . . . . . . 30,316 44,995 37,227 280
Other . . . . . . . . . . . . . . . . . . . . 4,227 4,542 4,728 35
Total . . . . . . . . . . . . . . . . . 303,460 346,263 352,192 2,648
Corporate . . . . . . . . . . . . . . . . . 3,045 2,005 1,943 15
Consolidated total . . . . . . . . . . . . . ¥306,505 ¥348,268 ¥354,135 $2,663
Capital expenditures for segment
assets:
Electronics . . . . . . . . . . . . . . . . ¥227,079 ¥285,385 ¥222,991 $1,677
Game . . . . . . . . . . . . . . . . . . . . 118,960 108,168 47,822 360
Music . . . . . . . . . . . . . . . . . . . . 24,644 37,776 21,535 162
Pictures . . . . . . . . . . . . . . . . . . 11,947 11,020 11,501 86
Financial Services . . . . . . . . . . . 43,332 9,341 16,023 120
Other . . . . . . . . . . . . . . . . . . . . 7,691 11,829 3,578 27
Total . . . . . . . . . . . . . . . . . 433,653 463,519 323,450 2,432
Corporate . . . . . . . . . . . . . . . . . 2,234 1,690 3,284 25
Consolidated total . . . . . . . . . . . . . ¥435,887 ¥465,209 ¥326,734 $2,457
70
Sony Corporation Annual Report 2002