Sony 2002 Annual Report Download - page 71
Download and view the complete annual report
Please find page 71 of the 2002 Sony annual report below. You can navigate through the pages in the report by either clicking on the pages listed below, or by using the keyword search tool below to find specific information within the annual report.-
 1
1 -
2
-
3
-
4
-
5
-
6
-
7
-
8
-
9
-
10
-
11
-
12
-
13
-
14
-
15
-
16
-
17
-
18
-
19
-
20
-
21
-
22
-
23
-
24
-
25
-
26
-
27
-
28
-
29
-
30
-
31
-
32
-
33
-
34
-
35
-
36
-
37
-
38
-
39
-
40
-
41
-
42
-
43
-
44
-
45
-
46
-
47
-
48
-
49
-
50
-
51
-
52
-
53
-
54
-
55
-
56
-
57
-
58
-
59
-
60
-
 61
61 -
 62
62 -
 63
63 -
 64
64 -
 65
65 -
 66
66 -
 67
67 -
 68
68 -
 69
69 -
 70
70 -
 71
71 -
 72
72 -
 73
73 -
 74
74 -
 75
75 -
 76
76 -
 77
77 -
 78
78 -
 79
79 -
 80
80 -
 81
81 -
82
-
83
-
84
 |
 |

Segment Information
Sony Corporation and Consolidated Subsidiaries - Year ended March 31
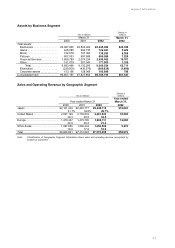
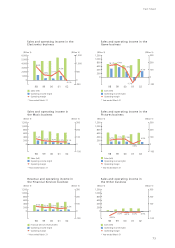
Sales and Operating Revenue by Business Segment
«Electronics Sales and Operating Revenue to Customers by Product Category»
Audio . . . . . . . . . . . . . . . . . . . . . ¥ 733,431 ¥ 756,393 ¥ 747,469 $5,620
16.7% 15.1% 15.6%
Video . . . . . . . . . . . . . . . . . . . . . 665,429 791,465 806,401 6,063
15.1 15.8 16.8
Televisions . . . . . . . . . . . . . . . . 636,213 703,698 747,877 5,623
14.5 14.1 15.6
Information and communications . 1,031,661 1,322,818 1,227,685 9,231
23.5 26.5 25.6
Semiconductors . . . . . . . . . . . . . 164,196 237,668 182,276 1,371
3.7 4.7 3.8
Components . . . . . . . . . . . . . . . 568,387 612,520 572,465 4,304
12.9 12.3 12.0
Other . . . . . . . . . . . . . . . . . . . . . 597,885 574,866 508,866 3,826
13.6 11.5 10.6
Total . . . . . . . . . . . . . . . . . . . . . . ¥4,397,202 ¥4,999,428 ¥4,793,039 $36,038
Note: The above table is a breakdown of Electronics sales and operating revenue to customers by product
category.
The Electronics business is managed as a single operating segment by Sony’s
management.
However, Sony believes that the information in this table is useful to investors in
understanding the sales contributions of the products in this business segment.
In addition,
commencing with the first quarter ended June 30, 2001, Sony has partly realigned its product
category configuration in the Electronics business.
In accordance with this change, results of the
previous years have been reclassified to conform to the presentation for the year ended March 31,
2002.
Sales of mobile phones are no longer recorded in the “Information and Communications”
category as of the third quarter of the current fiscal year.
From the third quarter, sales of mobile
phones manufactured for Sony Ericsson Mobile Communications are recorded in the “Other” product
category.
Yen in millions
Dollars in
millions
Year ended March 31
Year ended
March 31,
2000 2001
2002 2002
Electronics―
Customers . . . . . . . . . . . . . . . . . ¥4,397,202 ¥4,999,428 ¥4,793,039 $36,038
Intersegment . . . . . . . . . . . . . . . 273,800 473,966 517,407 3,890
Total . . . . . . . . . . . . . . . . . . . . . 4,671,002 5,473,394 5,310,446 39,928
Game―
Customers . . . . . . . . . . . . . . . . . 630,662 646,147 986,529 7,418
Intersegment . . . . . . . . . . . . . . . 24,074 14,769 17,185 129
Total . . . . . . . . . . . . . . . . . . . . . 654,736 660,916 1,003,714 7,547
Music―
Customers . . . . . . . . . . . . . . . . . 665,047 571,003 588,191 4,422
Intersegment . . . . . . . . . . . . . . . 41,837 41,110 54,649 411
Total . . . . . . . . . . . . . . . . . . . . . 706,884 612,113 642,840 4,833
Pictures―
Customers . . . . . . . . . . . . . . . . . 494,332 555,227 635,841 4,781
Intersegment . . . . . . . . . . . . . . . 394 0 00
Total . . . . . . . . . . . . . . . . . . . . . 494,726 555,227 635,841 4,781
Financial Services―
Customers . . . . . . . . . . . . . . . . . 412,988 447,147 483,313 3,634
Intersegment . . . . . . . . . . . . . . . 25,774 31,677 28,932 218
Total . . . . . . . . . . . . . . . . . . . . . 438,762 478,824 512,245 3,852
Other―
Customers . . . . . . . . . . . . . . . . . 86,430 95,872 91,345 686
Intersegment . . . . . . . . . . . . . . . 55,132 60,526 55,042 414
Total . . . . . . . . . . . . . . . . . . . . . 141,562 156,398 146,387 1,100
Elimination . . . . . . . . . . . . . . . . . (421,011) (622,048) (673,215) (5,062)
Consolidated total . . . . . . . . . . . . . ¥6,686,661 ¥7,314,824 ¥7,578,258 $56,979
Note: Electronics intersegment amounts primarily consist of transactions with the Game business.
Music intersegment amounts primarily consist of transactions with Game and Pictures businesses.
Other intersegment amounts primarily consist of transactions with the Electronics business.
Segment Information
69