Sony 2010 Annual Report Download - page 23
Download and view the complete annual report
Please find page 23 of the 2010 Sony annual report below. You can navigate through the pages in the report by either clicking on the pages listed below, or by using the keyword search tool below to find specific information within the annual report.-
 1
1 -
2
-
3
-
4
-
5
-
6
-
7
-
8
-
9
-
10
-
11
-
12
-
 13
13 -
 14
14 -
 15
15 -
 16
16 -
 17
17 -
 18
18 -
 19
19 -
 20
20 -
 21
21 -
 22
22 -
 23
23 -
 24
24 -
 25
25 -
 26
26 -
 27
27 -
 28
28 -
 29
29 -
 30
30 -
 31
31 -
 32
32 -
 33
33 -
34
-
35
-
36
-
37
-
38
-
39
-
40
-
41
-
42
-
43
-
44
-
45
-
46
-
47
-
48
-
49
-
50
-
51
-
52
-
53
-
54
-
55
-
56
-
57
-
58
-
59
-
60
-
61
-
62
-
63
-
64
 |
 |

20
Pictures
Consumer Products &
Devices
Networked Products &
Services
B2B & Disc Manufacturing
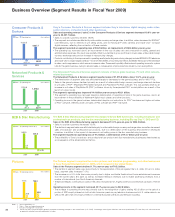
Sony’s Consumer Products & Devices segment includes Sony’s televisions, digital imaging, audio-video,
semiconductors, components and other businesses.
Sales and operating revenue (“sales”) in the Consumer Products & Devices segment decreased 19.9% year-on-
year, to ¥3,227.7 billion.
Sales to outside customers declined 18.8%.
The segment as a whole was affected by unfavorable currency exchange rates. In addition, sales decreased for BRAVIA™
LCD televisions, due to declines in unit selling prices, and for Handycam® video cameras and Cyber-shot™ compact
digital cameras, reflecting the contraction of these markets.
The segment recorded an operating loss of ¥46.5 billion, an improvement of ¥68.6 billion year-on-year.
The operating loss narrowed due to an improvement in the cost of sales ratio and a reduction in selling, general and
administrative expenses; this result was partially offset by a decline in gross profit due to lower sales, unfavorable foreign
currency exchange rates and an increase in restructuring charges.
Products contributing to the improvement in operating results (excluding restructuring charges) included BRAVIA LCD televisions
and Cyber-shot compact digital cameras—for which the benefits of cost reduction efforts exceeded the impact of the decrease
in sales—and image sensors, which saw an increase in sales. These results partially offset reduced operating income for system
LSIs for the game business, owing to reduced sales, a consequence of price reductions driven by cost saving efforts.
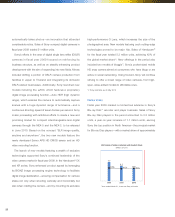
The Networked Products & Services segment consists of Sony’s game business, PC and other network-
related businesses.
The Networked Products & Services segment reported sales of ¥1,575.8 billion, down 10.2% year-on-year.
The deterioration of segment sales was attributable largely to decreases for the game business and for VAIO™ PCs.
Sales in the game business declined primarily as a result of unfavorable foreign currency exchange rates and declines
in unit sales of PSP™ (PlayStation®Portable) hardware and PlayStation®2 (PS2) software. This was partially offset by an
increase in unit sales of PlayStation®3 (PS3™) software, driven by the expanded PS3™ model platform as a result of the
launch of a new model.
The segment’s operating loss improved ¥4.4 billion year-on-year, to ¥83.1 billion.
The segment’s operating loss narrowed despite a deterioration of operating income in the game business, due to an
improvement in the profitability of Walkman® digital music players and other products.
Operating income in the game business deteriorated despite cost reductions for PS3™ hardware and higher unit sales
of PS3™ software, reflecting lower unit sales of PS2 software and PSP™ hardware.
The B2B & Disc Manufacturing segment encompasses Sony’s B2B businesses, including broadcast- and
professional-use products, and the disc manufacturing business, including Blu-ray Disc™, DVD and CD.
Sales in the B2B & Disc Manufacturing segment decreased 10.0% year-on-year, to ¥504.2 billion.
Sales to outside customers decreased 13.0%.
The decline in segment sales was attributable largely to unfavorable foreign currency exchange rates, as well as decreased
sales of broadcast- and professional-use products, due to a deterioration of the business environment in developed
countries, in addition to the impact of decreases in unit selling prices in the disc manufacturing business.
The segment reported an operating loss of ¥7.2 billion, a deterioration of ¥13.7 billion year-on-year.
The profitability of Sony’s broadcast- and professional-use product and disc manufacturing businesses deteriorated as
a consequence of the aforementioned factors.
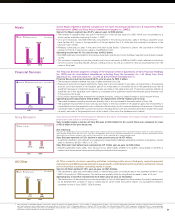
The Pictures segment comprises the motion pictures and television programming, and other businesses
of Sony Pictures Entertainment Inc. (SPE), which is based in the United States.
Sales in the Pictures segment declined 1.7% year-on-year, to ¥705.2 billion.
The decline in segment sales was due primarily to the appreciation of the yen against the U.S. dollar. (On a U.S. dollar
basis, segment sales increased 7.0%.)
The increase on a U.S. dollar basis was primarily due to higher worldwide theatrical and home entertainment revenues
from the current year’s film slate, as well as increased television revenues due to higher advertising revenues from a
number of international (non-North America) channels.
Theatrical releases contributing to sales in the period included 2012, Angels & Demons and Michael Jackson’s THIS IS
IT.
Operating income in the segment increased 43.1% year-on-year, to ¥42.8 billion.
The increase in operating income was primarily due to the recognition of gains totaling ¥30.3 billion on the sale of a
portion of SPE’s equity interests in both a Latin American premium pay television business and a U.S. cable network, as
well as the sale of all of its equity interest in a Central European premium pay television business.
Business Overview (Segment Results in Fiscal Year 2009)
4,031.5
(115.1)
3,227.7
(Yen in billions)
(46.5)
2009 2010
Sales Operating loss
1,755.6 1,575.8
(Yen in billions)
(87.4)(83.1)
2009 2010
Sales Operating loss
560.0 504.2
6.5
(7.2)
(Yen in billions)
2009 2010
Sales Operating income (loss)
717.5 705.2
29.9 42.8
(Yen in billions)
2009 2010
Sales Operating income
Notes: 1. Years ended March 31
2. Sales = Sales and operating revenue
3. Includes intersegment transactions
4. Results for Sony Life are based on generally accepted accounting principles in the United States (U.S. GAAP). Accordingly, these figures differ from the results published by SFH and Sony Life, which are based
on generally accepted accounting principles in Japan.