Sony 2010 Annual Report Download - page 52
Download and view the complete annual report
Please find page 52 of the 2010 Sony annual report below. You can navigate through the pages in the report by either clicking on the pages listed below, or by using the keyword search tool below to find specific information within the annual report.-
 1
1 -
2
-
3
-
4
-
5
-
6
-
7
-
8
-
9
-
10
-
11
-
12
-
13
-
14
-
15
-
16
-
17
-
18
-
19
-
20
-
21
-
22
-
23
-
24
-
25
-
26
-
27
-
28
-
29
-
30
-
31
-
32
-
33
-
34
-
35
-
36
-
37
-
38
-
39
-
40
-
41
-
 42
42 -
 43
43 -
 44
44 -
 45
45 -
 46
46 -
 47
47 -
 48
48 -
 49
49 -
 50
50 -
 51
51 -
 52
52 -
 53
53 -
 54
54 -
 55
55 -
 56
56 -
 57
57 -
 58
58 -
 59
59 -
 60
60 -
 61
61 -
 62
62 -
63
-
64
 |
 |

49
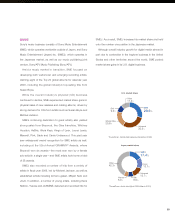
SALES AND OPERATING REVENUE TO CUSTOMERS BY PRODUCT CATEGORY
Yen in millions
Years ended March 31 2008 2009 2010
Consumer Products & Devices
Televisions .....................................................
1,357,116 1,275,692 1,005,773
Digital Imaging .................................................. 1,113,407 863,837
679,225
Audio and Video ................................................. 644,475 555,706
469,606
Semiconductors ................................................. 321,032 267,167
277,885
Components .................................................... 788,004 623,931
479,145
Other ......................................................... 14,513 10,900
9,769
Total ............................................................ 4,238,547 3,597,233
2,921,403
Networked Products & Services
Game ......................................................... 1,219,004 984,855
840,711
PC and Other Networked Businesses ................................. 823,556 699,903
670,904
Total ............................................................ 2,042,560 1,684,758
1,511,615
B2B & Disc Manufacturing ........................................... 536,945 464,321
404,114
Pictures ......................................................... 855,482 717,513
705,237
Music ........................................................... 204,818 363,074
511,097
Financial Services .................................................. 553,216 523,307
838,300
All Other ......................................................... 359,468 318,422
261,851
Corporate ........................................................ 80,378 61,365
60,381
Consolidated total ................................................. 8,871,414 7,729,993
7,213,998
Note: The above table includes a breakdown of sales and operating revenue to external customers by product category in the Consumer Products & Devices and Networked
Products & Services segments. The Consumer Products & Devices and Networked Products & Services segments are each managed as a single operating segment by
Sony’s management.
SALES AND OPERATING REVENUE BY GEOGRAPHIC INFORMATION
Yen in millions
Years ended March 31 2008 2009 2010
Japan ............................................................
2,056,374 1,873,219 2,099,297
........................................................................ 23.2% 24.2% 29.1%
U.S.A. ...........................................................
2,221,862 1,827,812 1,595,016
........................................................................ 25.1 23.6 22.1
Europe ...........................................................
2,328,233 1,987,692 1,644,698
........................................................................ 26.2 25.7 22.8
Other ............................................................
2,264,945 2,041,270 1,874,987
........................................................................ 25.5 26.5 26.0
Total .............................................................
8,871,414 7,729,993 7,213,998
Note: Classification of geographic segment information shows sales and operating revenue recognized by location of customers.