Sony 2010 Annual Report Download - page 5
Download and view the complete annual report
Please find page 5 of the 2010 Sony annual report below. You can navigate through the pages in the report by either clicking on the pages listed below, or by using the keyword search tool below to find specific information within the annual report.-
 1
1 -
 2
2 -
 3
3 -
 4
4 -
 5
5 -
 6
6 -
 7
7 -
 8
8 -
 9
9 -
 10
10 -
 11
11 -
 12
12 -
 13
13 -
 14
14 -
 15
15 -
 16
16 -
17
-
18
-
19
-
20
-
21
-
22
-
23
-
24
-
25
-
26
-
27
-
28
-
29
-
30
-
31
-
32
-
33
-
34
-
35
-
36
-
37
-
38
-
39
-
40
-
41
-
42
-
43
-
44
-
45
-
46
-
47
-
48
-
49
-
50
-
51
-
52
-
53
-
54
-
55
-
56
-
57
-
58
-
59
-
60
-
61
-
62
-
63
-
64
 |
 |

2
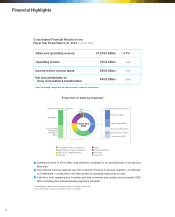
Financial Highlights
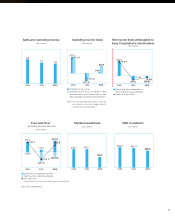
Sales and operating revenue ¥7,214.0 billion ( -6.7%)
Operating income ¥31.8 billion (—)
Income before income taxes ¥26.9 billion (—)
¥40.8 billion (—)
Note: Percentage change from the prior fiscal year is shown in parentheses.
Consolidated Financial Results for the
Fiscal Year Ended March 31, 2010 (Fiscal Year 2009)
● Operating income of ¥31.8 billion was achieved, compared to an operating loss in the previous
scal year.
● The Financial Services segment and the Consumer Products & Devices segment—in particular,
LCD televisions—contributed to the improvement in operating results year-on-year.
● Cash ow from operating and investing activities combined was positive and exceeded ¥300
billion excluding the Financial Services segment’s activities*2.
Net loss attributable to
Sony Corporation’s stockholders
Proportion of sales by business*1
9.8%
5.6%
40.5%
21.0%
7.1%
11.6%
3.6%
0.8%
Audio and Video17%
Networked Products & Services Consumer Products & Devices
Digital Imaging23%
Televisions34%
Game56%
PC and Other
Networked
Businesses
44%
Semiconductors10%
Components16%
Fiscal Year
2009
Consumer Products & Devices
Networked Products & Services
B2B & Disc Manufacturing
Pictures
Music
Financial Services
All Other
Corporate
*1 Percentage of sales and operating revenue to outside customers
*2 This information is not in accordance with U.S. GAAP.