Sony 2010 Annual Report Download - page 55
Download and view the complete annual report
Please find page 55 of the 2010 Sony annual report below. You can navigate through the pages in the report by either clicking on the pages listed below, or by using the keyword search tool below to find specific information within the annual report.-
 1
1 -
2
-
3
-
4
-
5
-
6
-
7
-
8
-
9
-
10
-
11
-
12
-
13
-
14
-
15
-
16
-
17
-
18
-
19
-
20
-
21
-
22
-
23
-
24
-
25
-
26
-
27
-
28
-
29
-
30
-
31
-
32
-
33
-
34
-
35
-
36
-
37
-
38
-
39
-
40
-
41
-
42
-
43
-
44
-
 45
45 -
 46
46 -
 47
47 -
 48
48 -
 49
49 -
 50
50 -
 51
51 -
 52
52 -
 53
53 -
 54
54 -
 55
55 -
 56
56 -
 57
57 -
 58
58 -
 59
59 -
 60
60 -
 61
61 -
 62
62 -
 63
63 -
 64
64
 |
 |

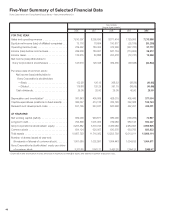
52
Yen in millions
2008 2009 2010
Sales and operating revenue:
Net sales .........................................................
8,201,839 7,110,053 6,293,005
Financial service revenue .............................................
553,216 523,307 838,300
Other operating revenue ..............................................
116,359 96,633 82,693
...............................................................
8,871,414 7,729,993 7,213,998
Costs and expenses:
Cost of sales ......................................................
6,290,022 5,660,504 4,892,563
Selling, general and administrative . . . . . . . . . . . . . . . . . . . . . . . . . . . . . . . . . . . . . .
1,714,445 1,686,030 1,544,890
Financial service expenses ............................................
530,306 547,825 671,550
(Gain) loss on sale, disposal or impairment of assets, net .....................
(37,841) 38,308 42,988
...............................................................
8,496,932 7,932,667 7,151,991
Equity in net income (loss) of affiliated companies .......................
100,817 (25,109) (30,235)
Operating income (loss) ............................................
475,299 (227,783) 31,772
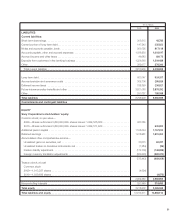
Other income:
Interest and dividends ...............................................
34,272 22,317 13,191
Gain on sale of securities investments, net ................................
5,504 1,281 9,953
Foreign exchange gain, net ...........................................
5,571 48,568 —
Gain on initial public offering of Sony Financial Holdings ......................
81,040 — —
Other ............................................................
23,060 26,659 20,690
...............................................................
149,447 98,825 43,834
Other expenses:
Interest ...........................................................
22,931 24,376 22,505
Loss on devaluation of securities investments . . . . . . . . . . . . . . . . . . . . . . . . . . . . .
13,087 4,427 2,946
Foreign exchange loss, net ............................................
— — 10,876
Other ............................................................
21,594 17,194 12,367
...............................................................
57,612 45,997 48,694
Income (loss) before income taxes ....................................
567,134 (174,955) 26,912
Income taxes:
Current ...........................................................
183,438 80,521 48,698
Deferred ..........................................................
20,040 (153,262) (34,740)
...............................................................
203,478 (72,741) 13,958
Net income (loss) ..................................................
363,656 (102,214) 12,954
Less—net income (loss) attributable to noncontrolling interests . . . . . . . . . . . . . . . .
(5,779) (3,276) 53,756
Net income (loss) attributable to Sony Corporation’s stockholders
................
369,435 (98,938) (40,802)
(Continued on following page)
Consolidated Statements of Income
Sony Corporation and Consolidated Subsidiaries—Years ended March 31