Sony 2010 Annual Report Download - page 58
Download and view the complete annual report
Please find page 58 of the 2010 Sony annual report below. You can navigate through the pages in the report by either clicking on the pages listed below, or by using the keyword search tool below to find specific information within the annual report.-
 1
1 -
2
-
3
-
4
-
5
-
6
-
7
-
8
-
9
-
10
-
11
-
12
-
13
-
14
-
15
-
16
-
17
-
18
-
19
-
20
-
21
-
22
-
23
-
24
-
25
-
26
-
27
-
28
-
29
-
30
-
31
-
32
-
33
-
34
-
35
-
36
-
37
-
38
-
39
-
40
-
41
-
42
-
43
-
44
-
45
-
46
-
47
-
 48
48 -
 49
49 -
 50
50 -
 51
51 -
 52
52 -
 53
53 -
 54
54 -
 55
55 -
 56
56 -
 57
57 -
 58
58 -
 59
59 -
 60
60 -
 61
61 -
 62
62 -
 63
63 -
 64
64
 |
 |

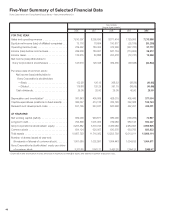
55
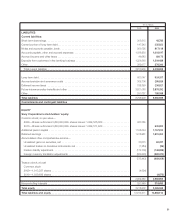
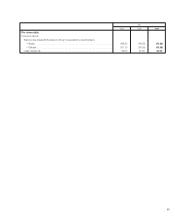
Yen in millions
2008 2009 2010
Cash flows from investing activities:
Payments for purchases of long-lived assets .............................
(474,552) (496,125) (338,050)
Proceeds from sales of long-lived assets ................................
144,741 153,439 15,671
Payments for investments and advances by financial service business .........
(2,283,491) (2,496,783) (1,581,841)
Payments for investments and advances (other than financial service business) ...
(103,082) (178,335) (41,838)
Proceeds from maturities of marketable securities, sales of securities
investments and collections of advances by financial service business ..........
1,441,496 1,923,264 1,128,500
Proceeds from maturities of marketable securities, sales of securities
investments and collections of advances (other than financial service business) ...
51,947 11,569 54,324
Proceeds from sales of shares of Sony Financial Holdings . . . . . . . . . . . . . . . . . .
305,280 — —
Other ..........................................................
7,219 1,629 17,230
Net cash used in investing activities .............................
(910,442) (1,081,342) (746,004)
Cash flows from financing activities:
Proceeds from issuance of long-term debt . . . . . . . . . . . . . . . . . . . . . . . . . . . . . .
31,093 72,188 510,128
Payments of long-term debt .........................................
(34,701) (264,467) (144,105)
Increase (decrease) in short-term borrowings, net .........................
15,838 244,584 (250,252)
Increase in deposits from customers in the financial service business, net .......
485,965 261,619 276,454
Dividends paid ...................................................
(25,098) (42,594) (25,085)
Proceeds from the issuance of shares under stock-based compensation plans . .
7,484 378 114
Proceeds from the issuance of shares of Sony Financial Holdings .............
28,800 — —
Other .........................................................
(3,863) (4,250) (2,240)
Net cash provided by financing activities .........................
505,518 267,458 365,014
Effect of exchange rate changes on cash and cash equivalents . . . . . . . . . . . . . . . .
(66,228) (18,911) (1,098)
Net increase (decrease) in cash and cash equivalents . . . . . . . . . . . . . . . . . . . . . . .
286,532 (425,642) 530,819
Cash and cash equivalents at beginning of the fiscal year . . . . . . . . . . . . . . . . . . . .
799,899 1,086,431 660,789
Cash and cash equivalents at end of the fiscal year . . . . . . . . . . . . . . . . . . . . . . . . .
1,086,431 660,789 1,191,608
Supplemental data:
Cash paid during the fiscal year for—
Income taxes ....................................................
126,339 242,528 60,022
Interest ........................................................
18,817 22,729 19,821
Non-cash investing and financing activities—
Obtaining assets by entering into capital lease . . . . . . . . . . . . . . . . . . . . . . . . . . .
7,017 5,831 2,553