Target 2003 Annual Report Download - page 19
Download and view the complete annual report
Please find page 19 of the 2003 Target annual report below. You can navigate through the pages in the report by either clicking on the pages listed below, or by using the keyword search tool below to find specific information within the annual report.-
 1
1 -
2
-
3
-
4
-
5
-
6
-
7
-
8
-
 9
9 -
 10
10 -
 11
11 -
 12
12 -
 13
13 -
 14
14 -
 15
15 -
 16
16 -
 17
17 -
 18
18 -
 19
19 -
 20
20 -
 21
21 -
 22
22 -
 23
23 -
 24
24 -
 25
25 -
 26
26 -
 27
27 -
 28
28 -
 29
29 -
30
-
31
-
32
-
33
-
34
-
35
-
36
-
37
-
38
-
39
-
40
-
41
-
42
-
43
-
44
-
45
-
46
 |
 |

17
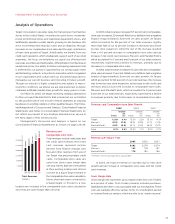
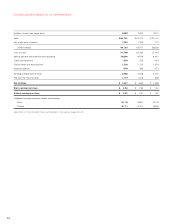
Analysis of Operations
Target Corporation operates large-format general merchandise
stores in the United States, including discount stores, moderate-
priced promotional stores and traditional department stores, and
additionally operates a small, rapidly growing on-line business. We
drive incremental merchandise sales and profitability through
increases in our comparable-store sales and through contribution
of new store growth at Target. Additionally, we benefit from our
credit card operations which strategically support each of our retail
segments. We focus on delighting our guests by offering both
everyday essentials and fashionable, differentiated merchandise at
exceptional prices. Our ability to deliver a shopping experience that
is preferred by our guests is supported by our strong supply chain
and technology network, a devotion to innovation which is ingrained
in our organization and culture and our disciplined approach to
managing our current business and investing in future growth.
Though our industry is highly competitive and subject to macro-
economic conditions, we believe we are well-positioned to deliver
continued profitable market share growth for many years to come.
On March 10, 2004, we began reviewing strategic alternatives
for Mervyn’s and Marshall Field’s that include but are not limited
to, the possible sale of one or both of these segments as ongoing
businesses to existing retailers or other qualified buyers. The follow-
ing Management’s Discussion and Analysis, Consolidated Financial
Statements, and Notes to Consolidated Financial Statements do
not reflect any impact of any strategic alternatives as we are in
the early stages of this review process.
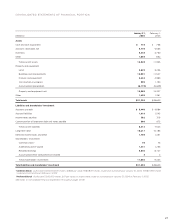
Management’s Discussion and Analysis is based on our
Consolidated Financial Statements as shown on pages 26-29.
Revenues and
Comparable-store Sales
Total revenues include retail sales and
net credit card revenues. Net credit
card revenues represent income
derived from finance charges, late
fees and other revenues from use of
our Target Visa and proprietary credit
cards. Comparable-store sales are
sales from stores open longer than
one year. Stores that were remodeled
at their existing location and did not
convert to a SuperTarget remain in
the comparable-store sales calculation.
Stores that have been converted to
a SuperTarget or moved to a new
location are included in the comparable-store sales calculation
once they are open longer than one year.
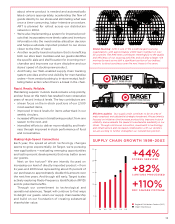
In 2003, total revenues increased 9.7 percent and comparable-
store sales increased 2.9 percent. Retail price deflation had a negative
impact of approximately 3 percent on sales growth. At Target,
which accounted for 86 percent of our total revenues, slightly
more than half of our 12 percent increase in revenues was driven
by new store expansion, while the rest of the increase resulted
from a 4.4 percent increase in comparable-store sales and an
increase in net credit card revenues. Mervyn’s and Marshall Field’s,
which accounted for 7 percent and 5 percent of our total revenues,
respectively, experienced a decline in revenues, primarily due to
decreases in comparable-store sales.
In 2002, total revenues increased 10.3 percent and comparable-
store sales increased 1.1 percent. Retail price deflation had a negative
impact of approximately 3 percent on sales growth. At Target,
which accounted for 84 percent of our total revenues, the increase
was driven by new store expansion, an increase in net credit card
revenues and a 2.2 percent increase in comparable-store sales.
Mervyn’s and Marshall Field’s, which accounted for 9 percent and
6 percent of our total revenues, respectively, experienced a decline
in revenues primarily due to decreases in comparable-store sales.
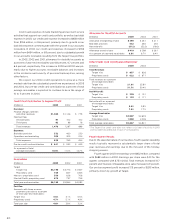
Revenues and Comparable-store Sales Growth
2003 2002 2001
Comparable- Comparable- Comparable-
store store store
Revenues Sales Revenues Sales Revenues Sales
Target 12.0% 4.4% 13.3% 2.2% 13.1% 4.1%
Mervyn’s (6.9) (7.6) (5.2) (5.3) (1.7) (1.5)
Marshall Field’s (4.0) (2.6) (3.1) (3.7) (5.2) (5.7)
Total 9.7% 2.9% 10.3% 1.1% 9.7% 2.7%
Revenues per Square Foot*
2003 2002 2001
Target $282 $278 $274
Mervyn’s 165 178 187
Marshall Field’s 178 180 186
* Thirteen-month average retail square feet.
In 2004, we expect revenues to increase due to new store
growth and an increase in comparable-store sales and net credit
card revenues.
Gross Margin Rate
Gross margin rate represents gross margin (sales less cost of sales)
as a percent of sales. Cost of sales primarily includes purchases,
markdowns and other costs associated with our merchandise. These
costs are partially offset by various forms of consideration earned
or received from our vendors, which we refer to as “vendor income.”
’99 ’00 ’01 ’02 ’03
$33,657
$36,851
$39,826
$43,917
$48,163
45,000
37,500
30,000
22,500
15,000
7,500
Total Revenues
(millions)
MANAGEMENT’S DISCUSSION AND ANALYSIS