Target 2003 Annual Report Download - page 24
Download and view the complete annual report
Please find page 24 of the 2003 Target annual report below. You can navigate through the pages in the report by either clicking on the pages listed below, or by using the keyword search tool below to find specific information within the annual report.-
 1
1 -
2
-
3
-
4
-
5
-
6
-
7
-
8
-
9
-
10
-
11
-
12
-
13
-
 14
14 -
 15
15 -
 16
16 -
 17
17 -
 18
18 -
 19
19 -
 20
20 -
 21
21 -
 22
22 -
 23
23 -
 24
24 -
 25
25 -
 26
26 -
 27
27 -
 28
28 -
 29
29 -
 30
30 -
 31
31 -
 32
32 -
 33
33 -
 34
34 -
35
-
36
-
37
-
38
-
39
-
40
-
41
-
42
-
43
-
44
-
45
-
46
 |
 |

22
Analysis of Financial Condition
Liquidity and Capital Resources
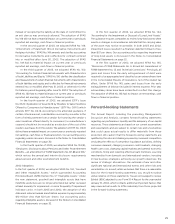
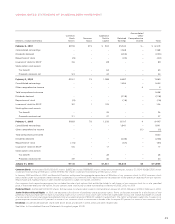
Our financial condition remains strong.
In assessing our financial condition,
management considers factors such
as cash flows provided by operations,
capital expenditures and debt service
obligations. Cash flow provided by
operations increased to $3.2 billion
in 2003 from $1.6 billion in 2002,
primarily due to a smaller increase in
our gross accounts receivable balance
and a higher net income.
During 2003, our total gross year-
end receivables increased 3.9 percent,
or $231 million, to $6,195 million. The
growth in year-end receivables was
driven by modest growth in issuance and usage of the Target Visa
credit card during 2003. Average total receivables in 2003 increased
21 percent reflecting the substantial growth of the Target Visa
credit card portfolio throughout 2002.
During 2003, inventory levels increased $583 million, or
12.2 percent. This growth was more than fully funded by the $764
million increase in accounts payable over the same period. The
increase in inventory was primarily a result of our store square
footage growth.
In January 1999 and March 2000, our Board of Directors
authorized the aggregate repurchase of $2 billion of our common
stock. Since that time, we have repurchased a total of 42 million
shares of our common stock at a total cost of $1,247 million
($29.39 per share), net of the premium from exercised and expired
put options. In 2001, common stock repurchases were essentially
suspended. Consequently, common stock repurchases did not
have a material impact on our 2003 or 2002 net earnings and
financial position.
Our financing strategy is to ensure liquidity and access to
capital markets, to manage the amount of floating-rate debt and
to maintain a balanced spectrum of debt maturities. Within these
parameters, we seek to minimize our cost of borrowing.
A key to our access to liquidity and capital markets is main-
taining strong investment-grade debt ratings.
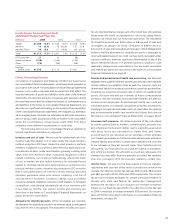
Credit Ratings
Standard
Moody’s and Poor’s Fitch
Long-term debt A2 A+ A
Commercial paper P-1 A-1 F1
Securitized receivables Aaa AAA n/a
Interest Coverage Ratio
We view interest coverage as an important indicator of our credit-
worthiness.
Interest coverage ratio represents the ratio of pre-tax earnings
before fixed charges to fixed charges (interest expense and the
interest portion of rent expense). Our interest coverage ratio was
5.5x, 4.9x and 4.7x in 2003, 2002 and 2001, respectively.
Further liquidity is provided by $1.6 billion of committed lines
of credit obtained through a group of 26 banks. Of these credit
lines, an $800 million credit facility expires in June 2004 but
includes a one-year term-out option to June 2005. The remaining
$800 million credit facility expires in June 2008. There were no
balances outstanding at any time during 2003 or 2002 under these
agreements. These committed credit lines as well as most of our
long-term debt obligations contain certain financial covenants. We
are, and expect to remain, well within the compliance requirements
of these covenants. No material debt instrument contains provisions
requiring acceleration of payment upon a debt rating downgrade.
Management believes that cash flows from operations, proceeds
from long-term financing activities and issuance of short-term debt
will be sufficient to fund any seasonal buildup in inventories and meet
other cash requirements, including the refinancing of existing long-
term debt, growth in receivables and projected capital expenditures.
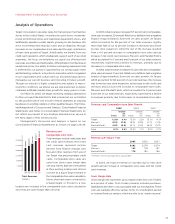
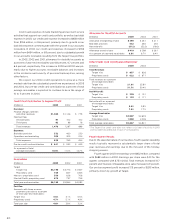
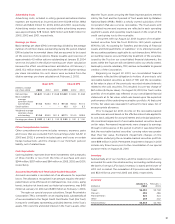
Capital Expenditures
Capital expenditures were $3,004
million in 2003, compared with
$3,221 million in 2002 and $3,163
million in 2001. Our modestly lower
spending level in 2003 is due to a
larger mix of leased stores and our
ability to accomplish our expansion
plans with less capital. Investment in
Target accounted for 90 percent of
capital expenditures in 2003 and
92 percent of capital expenditures in
both 2002 and 2001. Net property
and equipment increased $1,662
million in 2003, compared with an
increase of $1,774 million in 2002.
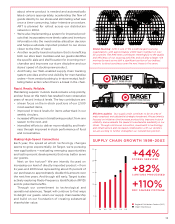
Over the past five years, Target’s net retail square footage has
grown at a compound annual rate of 10 percent, at the higher end
of our objective of 8 to 10 percent in new net growth annually.
Approximately 74 percent and 66 percent of total capital
expenditures in 2003 and 2002, respectively, were for new stores,
expansions and remodels. Other capital investments were for
information system hardware and software, distribution capacity
and other infrastructure to support store growth, primarily at Target.
’99 ’00 ’01 ’02 ’03
$1,918
$2,528
$3,163
$3,221
$3,004
3,000
2,250
1,500
750
Capital
Expenditures
(millions)
’99 ’00 ’01 ’02 ’03
$2,403
$2,134
$2,012
$1,590
$3,160
3,000
2,250
1,500
750
Cash Flow from
Operations
(millions)