Target 2003 Annual Report Download - page 22
Download and view the complete annual report
Please find page 22 of the 2003 Target annual report below. You can navigate through the pages in the report by either clicking on the pages listed below, or by using the keyword search tool below to find specific information within the annual report.-
 1
1 -
2
-
3
-
4
-
5
-
6
-
7
-
8
-
9
-
10
-
11
-
 12
12 -
 13
13 -
 14
14 -
 15
15 -
 16
16 -
 17
17 -
 18
18 -
 19
19 -
 20
20 -
 21
21 -
 22
22 -
 23
23 -
 24
24 -
 25
25 -
 26
26 -
 27
27 -
 28
28 -
 29
29 -
 30
30 -
 31
31 -
 32
32 -
33
-
34
-
35
-
36
-
37
-
38
-
39
-
40
-
41
-
42
-
43
-
44
-
45
-
46
 |
 |

20
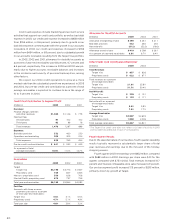
Credit card expenses include marketing and account service
activities that support our credit card portfolio, as well as bad debt
expense. In 2003, our credit card expense increased to $838 million
from $765 million, or 9.6 percent, primarily due to growth in our
bad debt expense commensurate with the growth in our accounts
receivable. In 2002, our credit card expenses increased to $765
million from $454 million, or 69 percent, due to substantial growth
in our accounts receivable resulting from the Target Visa portfolio.
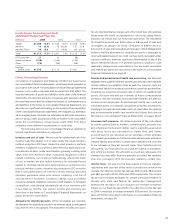
In 2003, 2002 and 2001, allowance for doubtful accounts as
a percent of year-end receivables was 6.8 percent, 6.7 percent and
6.4 percent, respectively. The increase in 2003 and 2002 was pri-
marily due to higher accounts receivable balances and increases
in the incidence and severity of personal bankruptcies, among
other factors.
We expect our 2004 credit operations to grow at a more
modest rate than the substantial growth we experienced in 2003
and 2002. Our pre-tax credit card contribution as a percent of total
average receivables is expected to continue to be in the range of
10 to 11 percent in 2004.
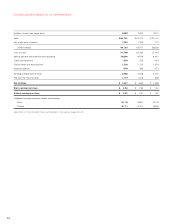
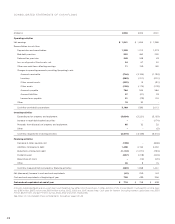
Credit Card Contribution to Segment Profit
(millions) 2003 2002 2001
Revenues:
Finance charges, late fees
and other revenues $1,300 $1,126 $ 779
Merchant fees
Intracompany 97 102 102
Third-party 82 69 18
Total revenues 1,479 1,297 899
Expenses:
Bad debt provision 532 460 230
Operations and marketing 306 305 224
Total expenses 838 765 454
Pre-tax credit card contribution $641 $ 532 $ 445
As a percent of total
average receivables 10.9% 11.0% 14.7%
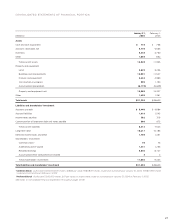
Receivables
(millions) 2003 2002 2001
Target
Target Visa $4,190 $3,774 $1,567
Proprietary card 783 827 1,063
Mervyn’s proprietary card 550 626 706
Marshall Field’s proprietary card 672 737 756
Total year-end receivables $6,195 $5,964 $4,092
Past Due
Accounts with three or more
payments past due as a percent
of total year-end receivables:
Target Visa 3.6% 3.1% 0.5%
Proprietary cards 4.7% 5.1% 4.9%
Total past due 4.0% 3.8% 3.2%
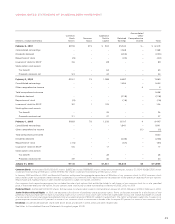
Allowance for Doubtful Accounts
(millions) 2003 2002 2001
Allowance at beginning of year $ 399 $ 261 $ 211
Bad debt provision 532 460 230
Net write-offs (512) (322) (180)
Allowance at end of year $ 419 $ 399 $ 261
As a percent of year-end receivables 6.8% 6.7% 6.4%
Other Credit Card Contribution Information*
(millions) 2003 2002
Total Revenues
Target Visa $857 $ 626
Proprietary cards $ 622 $ 671
Total revenues as a percent
of average receivables:
Target Visa 21.9% 23.8%
Proprietary cards 31.7% 30.4%
Net Write-offs
Target Visa $ 359 $ 151
Proprietary cards $ 153 $ 171
Net write-offs as a percent
of average receivables:
Target Visa 9.2% 5.8%
Proprietary cards 7.8% 7.7%
Average Receivables
Target Visa $3,907 $2,635
Proprietary cards 1,960 2,206
Total average receivables $5,867 $4,841
*The Target Visa credit card does not reflect a full year of activity in 2001
and has been excluded due to lack of comparability.
Fourth Quarter Results
Due to the seasonal nature of our business, fourth quarter operating
results typically represent a substantially larger share of total
year revenues and earnings due to the inclusion of the holiday
shopping season.
Fourth quarter 2003 net earnings were $832 million, compared
with $688 million in 2002. Earnings per share were $.91 for the
quarter, compared with $.75 in 2002. Total revenues increased 10.7
percent and 13-week comparable-store sales increased 4.9 percent.
Our pre-tax segment profit increased 17.3 percent to $1,513 million,
primarily driven by growth at Target.