Target 2003 Annual Report Download - page 30
Download and view the complete annual report
Please find page 30 of the 2003 Target annual report below. You can navigate through the pages in the report by either clicking on the pages listed below, or by using the keyword search tool below to find specific information within the annual report.-
 1
1 -
2
-
3
-
4
-
5
-
6
-
7
-
8
-
9
-
10
-
11
-
12
-
13
-
14
-
15
-
16
-
17
-
18
-
19
-
 20
20 -
 21
21 -
 22
22 -
 23
23 -
 24
24 -
 25
25 -
 26
26 -
 27
27 -
 28
28 -
 29
29 -
 30
30 -
 31
31 -
 32
32 -
 33
33 -
 34
34 -
 35
35 -
 36
36 -
 37
37 -
 38
38 -
 39
39 -
 40
40 -
41
-
42
-
43
-
44
-
45
-
46
 |
 |

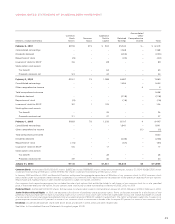
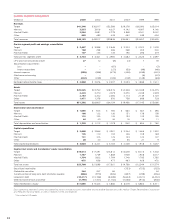
28
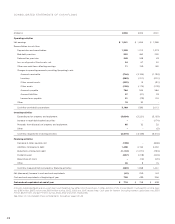
(millions) 2003 2002 2001
Operating activities
Net earnings $ 1,841 $ 1,654 $ 1,368
Reconciliation to cash flow:
Depreciation and amortization 1,320 1,212 1,079
Bad debt provision 532 460 230
Deferred tax provision 249 248 49
Loss on disposal of fixed assets, net 54 67 52
Other non-cash items affecting earnings 11 159 160
Changes in operating accounts providing/(requiring) cash:
Accounts receivable (744) (2,194) (1,193)
Inventory (583) (311) (201)
Other current assets (255) 15 (91)
Other assets (196) (174) (178)
Accounts payable 764 524 584
Accrued liabilities 57 (21) 29
Income taxes payable 91 (79) 124
Other 19 30 –
Cash flow provided by operations 3,160 1,590 2,012
Investing activities
Expenditures for property and equipment (3,004) (3,221) (3,163)
Increase in receivable-backed securities –– (174)
Proceeds from disposals of property and equipment 85 32 32
Other –– (5)
Cash flow required for investing activities (2,919) (3,189) (3,310)
Financing activities
Decrease in notes payable, net (100) – (808)
Additions to long-term debt 1,200 3,153 3,250
Reductions of long-term debt (1,172) (1,071) (793)
Dividends paid (237) (218) (203)
Repurchase of stock –(14) (20)
Other 26 815
Cash flow (required for)/provided by financing activities (283) 1,858 1,441
Net (decrease)/increase in cash and cash equivalents (42) 259 143
Cash and cash equivalents at beginning of year 758 499 356
Cash and cash equivalents at end of year $ 716 $ 758 $ 499
Amounts presented herein are on a cash basis and therefore may differ from those shown in other sections of this Annual Report. Cash paid for income taxes
was $781 million, $853 million and $666 million during 2003, 2002 and 2001, respectively. Cash paid for interest (including interest capitalized) was $550
million, $526 million and $477 million during 2003, 2002 and 2001, respectively.
See Notes to Consolidated Financial Statements throughout pages 30-39.
CONSOLIDATED STATEMENTS OF CASH FLOWS