Target 2003 Annual Report Download - page 33
Download and view the complete annual report
Please find page 33 of the 2003 Target annual report below. You can navigate through the pages in the report by either clicking on the pages listed below, or by using the keyword search tool below to find specific information within the annual report.-
 1
1 -
2
-
3
-
4
-
5
-
6
-
7
-
8
-
9
-
10
-
11
-
12
-
13
-
14
-
15
-
16
-
17
-
18
-
19
-
20
-
21
-
22
-
 23
23 -
 24
24 -
 25
25 -
 26
26 -
 27
27 -
 28
28 -
 29
29 -
 30
30 -
 31
31 -
 32
32 -
 33
33 -
 34
34 -
 35
35 -
 36
36 -
 37
37 -
 38
38 -
 39
39 -
 40
40 -
 41
41 -
 42
42 -
 43
43 -
44
-
45
-
46
 |
 |

31
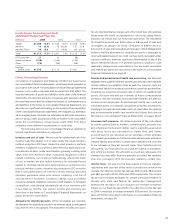
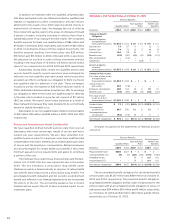
Advertising Costs
Advertising costs, included in selling, general and administrative
expense, are expensed as incurred and were $1,249 million, $962
million and $924 million for 2003, 2002 and 2001, respectively.
Advertising vendor income recorded within advertising expense
was approximately $78 million, $251 million and $231 million for
2003, 2002 and 2001, respectively.
Earnings per Share
Basic earnings per share (EPS) is net earnings divided by the average
number of common shares outstanding during the period. Diluted
EPS includes the incremental shares that are assumed to be issued
on the exercise of stock options. Shares issuable upon exercise of
approximately 4.5 million options outstanding at January 31, 2004
were not included in the dilutive earnings per share calculation
because the effect would have been antidilutive. At February 1,
2003, 13.2 million shares were excluded from the dilutive earnings
per share calculation. No such shares were excluded from the
dilutive earnings per share calculation at February 2, 2002.
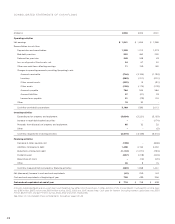
Basic EPS Diluted EPS
(millions, except
per share data) 2003 2002 2001 2003 2002 2001
Net earnings $1,841 $1,654 $1,368 $1,841 $1,654 $1,368
Basic weighted
average
common shares
outstanding 911.0 908.0 901.5 911.0 908.0 901.5
Stock options –––6.1 6.0 8.3
Weighted average
common shares
outstanding 911.0 908.0 901.5 917.1 914.0 909.8
Earnings per share $ 2.02 $ 1.82 $ 1.52 $ 2.01 $ 1.81 $ 1.50
Other Comprehensive Income
Other comprehensive income includes revenues, expenses, gains
and losses that are excluded from net earnings under GAAP. In
2003 and 2002, it primarily included gains and losses on certain
hedge transactions and the change in our minimum pension
liability, net of related taxes.
Cash Equivalents
Cash equivalents represent short-term investments with a maturity
of three months or less from the time of purchase and were
$244 million, $357 million and $84 million in 2003, 2002 and 2001,
respectively.
Accounts Receivable and Receivable-backed Securities
Accounts receivable is recorded net of an allowance for expected
losses. The allowance, recognized in an amount equal to the antici-
pated future write-offs based on delinquencies, risk scores, aging
trends, industry risk trends and our historical experience, was $419
million at January 31, 2004 and $399 million at February 1, 2003.
Through our special purpose subsidiary, Target Receivables
Corporation (TRC), we transfer, on an ongoing basis, substantially all
of our receivables to the Target Credit Card Master Trust (the Trust)
in return for certificates representing undivided interests in the Trust’s
assets. TRC owns the undivided interest in the Trust’s assets, other
than the Trust’s assets securing the financing transactions entered
into by the Trust and the 2 percent of Trust assets held by Retailers
National Bank (RNB). RNB is a wholly owned subsidiary of the
Corporation that also services receivables. The Trust assets and
the related income and expenses are reflected in each operating
segment’s assets and operating results based on the origin of the
credit card giving rise to the receivable.
Concurrent with our August 22, 2001 issuance of receivable-
backed securities from the Trust, SFAS No. 140 (which replaced
SFAS No. 125, “Accounting for Transfers and Servicing of Financial
Assets and Extinguishments of Liabilities,” in its entirety) became
the accounting guidance applicable to such transactions. While this
accounting requires secured financing treatment of the securities
issued by the Trust on our consolidated financial statements, the
assets within the Trust are still considered sold to our wholly owned,
bankruptcy remote subsidiary, TRC, and are not available to general
creditors of the Corporation.
Beginning on August 22, 2001, our consolidated financial
statements reflected the obligation to holders of previously sold
receivable-backed securities as debt of TRC and the receivables
at fair value in place of the previously recorded retained interests
related to the sold securities. This resulted in a pre-tax charge of
$67 million ($.05 per share). On August 22, 2001, the Trust’s entire
portfolio of receivables was reflected on our consolidated financial
statements at its fair value, which was based upon the expected
performance of the underlying receivables portfolio. At that point
in time, fair value was equivalent in amount to face value, net of
an appropriate allowance.
Prior to August 22, 2001, income on the receivable-backed
securities was accrued based on the effective interest rate applied to
its cost basis, adjusted for accrued interest and principal paydowns.
We monitored impairment of receivable-backed securities based
on fair value. Permanent impairments were charged to earnings
through credit expense in the period in which it was determined
that the receivable-backed securities’ carrying value was greater
than their fair value. Permanent impairment charges on the
receivables underlying the receivable-backed securities portfolio
were $89 million in 2001. Permanent impairment charges in 2001
include only those losses prior to the consolidation of our special
purpose entity on August 22, 2001.
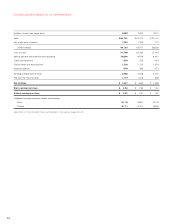
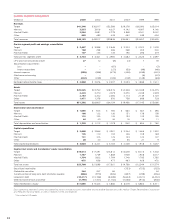
Inventory
Substantially all of our inventory and the related cost of sales is
accounted for under the retail inventory accounting method using
the last-in, first-out (LIFO) basis. Inventory is stated at the lower of
LIFO cost or market. The cumulative LIFO provision was $25 million
and $52 million at year-end 2003 and 2002, respectively.
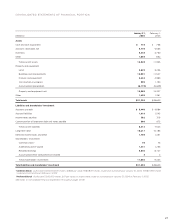
Inventory
January 31, February 1,
(millions) 2004 2003
Target $4,282 $3,748
Mervyn’s 486 486
Marshall Field’s 326 324
Other 249 202
Total inventory $5,343 $4,760