Target 2003 Annual Report Download - page 39
Download and view the complete annual report
Please find page 39 of the 2003 Target annual report below. You can navigate through the pages in the report by either clicking on the pages listed below, or by using the keyword search tool below to find specific information within the annual report.-
 1
1 -
2
-
3
-
4
-
5
-
6
-
7
-
8
-
9
-
10
-
11
-
12
-
13
-
14
-
15
-
16
-
17
-
18
-
19
-
20
-
21
-
22
-
23
-
24
-
25
-
26
-
27
-
28
-
 29
29 -
 30
30 -
 31
31 -
 32
32 -
 33
33 -
 34
34 -
 35
35 -
 36
36 -
 37
37 -
 38
38 -
 39
39 -
 40
40 -
 41
41 -
 42
42 -
 43
43 -
 44
44 -
 45
45 -
 46
46
 |
 |

37
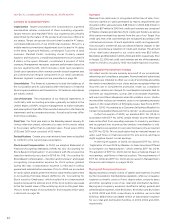
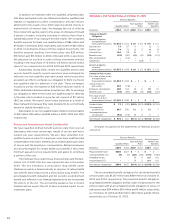
Net Pension and Postretirement Health Care Benefits Expense
Postretirement
Pension Benefits Health Care Benefits
(millions) 2003 2002 2001 2003 2002 2001
Service cost benefits
earned during
the period $74 $58 $50 $2 $2 $2
Interest cost on
projected benefit
obligation 75 75 69 888
Expected return
on assets (114) (108) (89) –––
Recognized losses 18 10 1 11–
Recognized prior
service cost (7) 11 –––
Settlement/curtailment
charges –(12) – –––
Total $46 $24 $32 $11 $11 $10
The amortization of any prior service cost is determined using
a straight-line amortization of the cost over the average remaining
service period of employees expected to receive benefits under
the plan.
Assumptions
Weighted average assumptions used to determine benefit obligations
at October 31:
Postretirement
Pension Benefits Health Care Benefits
2003 2002 2003 2002
Discount rate 6.25% 7.00% 6.25% 7.00%
Average assumed rate
of compensation increase 3.25% 4.00% n/a n/a
Weighted average assumptions used to determine net periodic
benefit cost for years ended October 31:
Postretirement
Pension Benefits Health Care Benefits
2003 2002 2003 2002
Discount rate 7.00% 7.25% 7.00% 7.25%
Expected long-term rate
of return on plan assets 8.50% 9.00% n/a n/a
Average assumed rate
of compensation increase 4.00% 4.25% n/a n/a
Our rate of return on qualified plans’ assets has averaged
5.4 percent and 9.6 percent per year over the 5-year and 10-year
periods ending October 31, 2003 (our measurement date). After
that date, we reduced our expected long-term rate of return on
plans’ assets to 8.0 percent per year.
An increase in the cost of covered health care benefits of
6.0 percent was assumed for 2003 and 2004. The rate is assumed
to remain at 6.0 percent in the future. The health care cost trend rate
assumption may have a significant effect on the amounts reported.
A one percent change in assumed health care cost trend rates
would have the following effects:
1% Increase 1% Decrease
Effect on total of service and interest cost
components of net periodic
postretirement health care benefit cost $ – $ –
Effect on the health care component
of the postretirement benefit obligation $5 $(5)
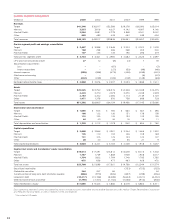
Additional Information
Our pension plan weighted average asset allocations at October 31,
2003 and 2002 by asset category are as follows:
Asset Category
2003 2002
Equity securities 56% 54%
Debt securities 26 24
Real estate 55
Other 13 17
Total 100% 100%
Our asset allocation strategy for 2004 targets 55 percent in
equity securities, 25 percent in debt securities, 5 percent in real
estate and 15 percent in other assets. Equity securities include our
common stock in amounts substantially less than 0.5 percent of
total plan assets at October 31, 2003 and 2002. Other assets
includes private equity, mezzanine and distressed debt and timber.
Our expected long-term rate of return assumptions as of October 31,
2003 are 8.5 percent, 5.5 percent, 7.0 percent and 10.0 percent for
equity securities, debt securities, real estate and other assets,
respectively.
Contributions
Given the qualified pension plans’ funded position, we are not
required to make any contributions in 2004. In similar situations
in the past, we have chosen to make discretionary contributions
for various purposes, including minimizing Pension Benefit Guaranty
Corporation premium payments and maintaining the fully-funded
status of the plans. In 2004, such discretionary contributions could
range from $0 to $200 million. We expect to make contributions
in the range of $5 million to $15 million to our other postretirement
benefit plans in 2004.
Estimated Future Benefit Payments
The following benefit payments, which reflect expected future
service, as appropriate, are expected to be paid:
Pension Postretirement
Benefits Health Care Benefits
2004 $ 59 $ 8
2005 62 9
2006 66 9
2007 70 10
2008 75 10
2009–2013 475 57
(millions)