Target 2003 Annual Report Download - page 37
Download and view the complete annual report
Please find page 37 of the 2003 Target annual report below. You can navigate through the pages in the report by either clicking on the pages listed below, or by using the keyword search tool below to find specific information within the annual report.-
 1
1 -
2
-
3
-
4
-
5
-
6
-
7
-
8
-
9
-
10
-
11
-
12
-
13
-
14
-
15
-
16
-
17
-
18
-
19
-
20
-
21
-
22
-
23
-
24
-
25
-
26
-
 27
27 -
 28
28 -
 29
29 -
 30
30 -
 31
31 -
 32
32 -
 33
33 -
 34
34 -
 35
35 -
 36
36 -
 37
37 -
 38
38 -
 39
39 -
 40
40 -
 41
41 -
 42
42 -
 43
43 -
 44
44 -
 45
45 -
 46
46
 |
 |

35
offset by a decrease in property related liabilities of $31 million. Our
current year postretirement health care and deferred compensation
plan activity is discussed below.
Stock Option Plans
We have stock option plans for key employees and non-employee
members of our Board of Directors. Our long-term incentive plans
provide for the granting of stock options, performance share
awards, restricted stock awards, or a combination of awards.
Performance share awards represent shares issuable in the future
based upon attainment of specified levels of future financial
performance. A majority of the awards are non-qualified stock
options that vest annually in equal amounts over a four-year
period. These options expire no later than ten years after the date
of the grant. Options granted to the non-employee members of
our Board of Directors vest after one year and have a ten-year
term. In early 2003, we stopped issuing new shares for our stock
option plan and began purchasing shares from the market. The
number of unissued common shares reserved for future grants
under the stock option plans was 19,279,658 at January 31, 2004
and 24,091,318 at February 1, 2003.
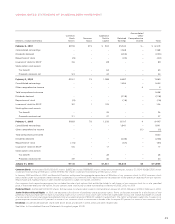
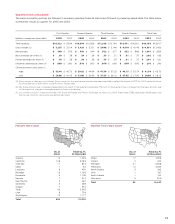
Options and Performance Share Awards Outstanding
Options
Total Outstanding Currently Exercisable Performance
Shares
Number of Average Number of Average Potentially
(options and shares in thousands) Options Price
*
Options Price
*
Issuable
February 3, 2001 32,258 $ 19.30 18,662 $ 12.36 –
Granted 4,805 40.52
Canceled (437) 30.41
Exercised (5,311) 9.42
February 2, 2002 31,315 $ 24.07 17,629 $ 17.04 –
Granted 6,096 30.60 552
Canceled (561) 35.55
Exercised (2,063) 12.22
February 1, 2003 34,787 $ 25.73 21,931 $ 20.89 552
Granted 4,638 38.34 573
Canceled (407) 34.77
Exercised (2,859) 12.58
January 31, 2004 36,159 $28.28 23,689 $24.48 1,125
* Weighted average exercise price.
Options Outstanding
Options Outstanding Currently Exercisable
Range of
Exercise Number Average Average Number Average
(options in thousands) Prices Outstanding Life
**
Price
*
Exercisable Price
*
$ 5.53–$ 9.99 5,058 2.2 $ 7.79 5,058 $ 7.79
$10.00–$ 19.99 4,718 3.7 18.31 4,718 18.31
$20.00–$ 29.99 3,500 4.5 25.92 3,467 25.92
$30.00–$ 39.99 18,473 7.9 33.91 8,266 33.30
$40.00–$44.83 4,410 7.8 40.84 2,180 40.81
Total $ 5.53–$44.83 36,159 6.2 $28.28 23,689 $24.48
* Weighted average exercise price.
** Weighted average contractual life remaining in years.
In the first quarter of 2003, we adopted SFAS No. 123 in
accordance with the prospective transition method prescribed in
SFAS No. 148. The adoption of this method increased compensation
expense by less than $.01 per share in 2003. The requirements of
SFAS No. 123 and SFAS No. 148 are discussed in Management’s
Discussion and Analysis on page 24.
Awards granted in fiscal year 2002 and earlier will continue to
be accounted for under the intrinsic value method prescribed in APB
No. 25. No compensation expense related to options was recognized
because the exercise price of our employee stock options equaled
the market price of the underlying stock on the grant date. The
expense related to the intrinsic value of performance-based and
restricted stock awards issued was not significant to 2003 net
earnings, cash flows or financial position. The pro forma impact of
accounting for those awards at fair value will continue to be
disclosed until the last of those awards vest in January of 2007. If
we had elected to recognize compensation cost based on the fair
value of the awards at the grant date, net earnings would have
been the pro forma amounts shown below.
Pro Forma Earnings
(millions, except per share data) 2003 2002 2001
Net earnings — as reported $1,841 $1,654 $1,368
Stock-based employee
compensation expense
included in reported
net earnings, net of tax 3––
Stock-based employee
compensation expense
determined under fair value
based method, net of tax (35) (31) (28)
Net earnings — pro forma $1,809 $1,623 $1,340
Earnings per share:
Basic — as reported $ 2.02 $ 1.82 $ 1.52
Basic — pro forma $ 1.99 $ 1.79 $ 1.49
Diluted — as reported $ 2.01 $ 1.81 $ 1.50
Diluted — pro forma $ 1.97 $ 1.78 $ 1.47
The Black-Scholes model was used to estimate the fair value
of the options at grant date based on the following assumptions:
2003 2002 2001
Dividend yield .8% .8% .6%
Volatility 29% 35% 30%
Risk-free interest rate 3.0% 3.0% 4.3%
Expected life in years 5.0 5.0 5.0
Weighted average fair value
at grant date $11.04 $10.07 $13.09
Defined Contribution Plans
Employees who meet certain eligibility requirements can participate
in a defined contribution 401(k) plan by investing up to 80 percent
of their compensation. We match 100 percent of each employee’s
contribution up to 5 percent of respective total compensation. Our
contribution to the plan is initially invested in Target Corporation
common stock. Benefits expense related to these matching
contributions was $117 million, $111 million and $97 million in 2003,
2002 and 2001, respectively.