Target 2003 Annual Report Download - page 41
Download and view the complete annual report
Please find page 41 of the 2003 Target annual report below. You can navigate through the pages in the report by either clicking on the pages listed below, or by using the keyword search tool below to find specific information within the annual report.-
 1
1 -
2
-
3
-
4
-
5
-
6
-
7
-
8
-
9
-
10
-
11
-
12
-
13
-
14
-
15
-
16
-
17
-
18
-
19
-
20
-
21
-
22
-
23
-
24
-
25
-
26
-
27
-
28
-
29
-
30
-
 31
31 -
 32
32 -
 33
33 -
 34
34 -
 35
35 -
 36
36 -
 37
37 -
 38
38 -
 39
39 -
 40
40 -
 41
41 -
 42
42 -
 43
43 -
 44
44 -
 45
45 -
 46
46
 |
 |

39
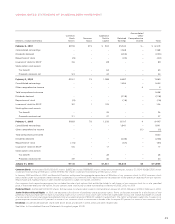
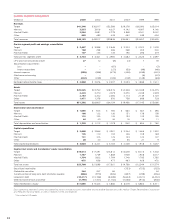
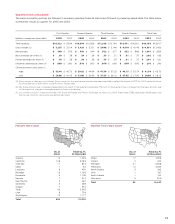
Quarterly Results (Unaudited)
The same accounting policies are followed in preparing quarterly financial data as are followed in preparing annual data. The table below
summarizes results by quarter for 2003 and 2002:
First Quarter Second Quarter Third Quarter Fourth Quarter Total Year
(millions, except per share data) 2003 2002 2003 2002 2003 2002 2003 2002 2003 2002
Total revenues $10,322 $ 9,594 $10,984 $10,068 $11,286 $10,194 $15,571 $14,061 $48,163 $43,917
Gross margin (a) $ 3,255 $ 3,014 $ 3,428 $ 3,151 $ 3,498 $ 3,148 $ 4,810 $ 4,149 $14,991 $13,462
Net earnings $ 349 $ 345 $ 358 $ 344 $ 302 $ 277 $832$ 688 $ 1,841 $ 1,654
Basic earnings per share (b) $ .38 $ .38 $ .39 $ .38 $ .33 $ .31 $ .91 $ .76 $ 2.02 $ 1.82
Diluted earnings per share (b) $ .38 $ .38 $ .39 $ .38 $ .33 $ .30 $ .91 $.75$ 2.01 $ 1.81
Dividends declared per share (b) $ .060 $ .060 $ .070 $ .060 $ .070 $ .060 $ .070 $ .060 $ .270 $ .240
Closing common stock price (c)
High $ 33.44 $ 45.72 $ 39.82 $ 44.94 $ 41.54 $ 37.25 $ 40.15 $ 35.74 $ 41.54 $ 45.72
Low $ 26.06 $ 41.45 $ 33.06 $ 30.46 $ 37.55 $ 26.15 $ 37.05 $ 27.00 $ 26.06 $ 26.15
(a) Gross margin is sales less cost of sales. Gross margin for first and second quarter have been adjusted to reflect the impact of EITF No. 02-16 reclassifications
for those periods of $36 million and $31 million, respectively.
(b) Per share amounts are computed independently for each of the quarters presented. The sum of the quarters may not equal the total year amount due
to the impact of changes in average quarterly shares outstanding.
(c) Our common stock is listed on the New York Stock Exchange and Pacific Exchange. At March 22, 2004, there were 17,582 registered shareholders and
the closing common stock price was $44.22 per share.
Mervyn’s Store Count Marshall Field’s Store Count
No. of Retail Sq. Ft.
Stores (in thousands)
Arizona 15 1,205
California 126 9,783
Colorado 11 853
Idaho 1 82
Louisiana 6 450
Michigan 15 1,165
Minnesota 9 1,159
Nevada 7 512
New Mexico 3 267
Oklahoma 3 268
Oregon 7 554
Texas 42 3,345
Utah 8 754
Washington 13 1,177
Total 266 21,574
No. of Retail Sq. Ft.
Stores (in thousands)
Illinois 17 4,908
Indiana 2 243
Michigan 21 4,828
Minnesota 12 3,069
North Dakota 3 295
Ohio 1 187
South Dakota 1 100
Wisconsin 5 816
Total 62 14,447