Target 2003 Annual Report Download - page 36
Download and view the complete annual report
Please find page 36 of the 2003 Target annual report below. You can navigate through the pages in the report by either clicking on the pages listed below, or by using the keyword search tool below to find specific information within the annual report.-
 1
1 -
2
-
3
-
4
-
5
-
6
-
7
-
8
-
9
-
10
-
11
-
12
-
13
-
14
-
15
-
16
-
17
-
18
-
19
-
20
-
21
-
22
-
23
-
24
-
25
-
 26
26 -
 27
27 -
 28
28 -
 29
29 -
 30
30 -
 31
31 -
 32
32 -
 33
33 -
 34
34 -
 35
35 -
 36
36 -
 37
37 -
 38
38 -
 39
39 -
 40
40 -
 41
41 -
 42
42 -
 43
43 -
 44
44 -
 45
45 -
 46
46
 |
 |

34
$400 million matured in 2002. We also terminated an interest rate
swap with a notional amount of $500 million, resulting in a gain
of $19 million that will be amortized into income over the life of
the hedged debt. In 2003 and 2002, the gains amortized into
income were not material to our results of operations.
Prior to 2003, we entered into rate lock agreements to hedge
the exposure to variability in future cash flows of forecasted debt
transactions. During 2002, transactions contemplated by these
agreements occurred and the gain or loss was recorded as a
component of other comprehensive income. The gain or loss will
be reclassified into earnings in the periods during which the
designated hedged cash flows affect earnings. These amounts are
reflected in the Consolidated Statements of Financial Position.
Cash flows from these hedging transactions are classified with the
item being hedged.
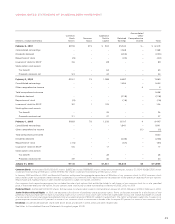
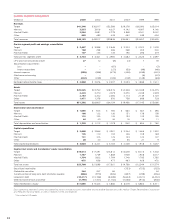
Interest Rate Swaps Outstanding at Year-end
(millions)
January 31, 2004 February 1, 2003
Notional Receive Pay Notional Receive Pay
Amount Fixed Floating*Amount Fixed Floating*
$500 7.5% 1.2% $500 7.5% 1.5%
550 4.6 1.3 550 4.6 1.4
200 4.9 1.1 ---
400 4.4 1.4 ---
500 4.4 1.2 ---
---400 5.1 1.4
* Reflects floating interest rate accrued at the end of the year.
Leases
Assets held under capital leases are included in property and
equipment and are charged to depreciation and interest over the
life of the lease. Operating leases are not capitalized and lease
rentals are expensed. Rent expense on buildings, classified in
selling, general and administrative expense, includes percentage
rents that are based on a percentage of retail sales over stated
levels. Total rent expense was $183 million in 2003, $179 million in
2002 and $171 million in 2001. Most of the long-term leases include
options to renew, with terms varying from one to 30 years. Certain
leases also include options to purchase the property.
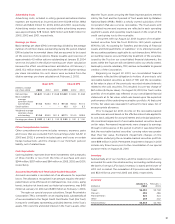
Future minimum lease payments required under noncancelable
lease agreements existing at January 31, 2004, were:
Future Minimum Lease Payments
Operating Capital
(millions) Leases Leases
2004 $ 163 $ 21
2005 150 20
2006 136 19
2007 125 19
2008 111 19
After 2008 1,093 166
Total future minimum lease payments $1,778 $264
Less: Interest*(780) (106)
Present value of minimum lease payments $ 998 $158**
* Calculated using the interest rate at inception for each lease (the weighted
average interest rate was 8.6 percent).
** Includes current portion of $9 million.
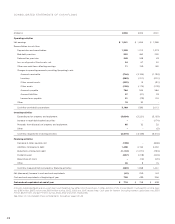
Income Taxes
Reconciliation of tax rates is as follows:
Tax Rate Reconciliation
2003 2002 2001
Federal statutory rate 35.0% 35.0% 35.0%
State income taxes,
net of federal tax benefit 3.3 3.4 3.3
Dividends on ESOP stock (.2) (.2) (.1)
Work opportunity tax credits (.2) (.2) (.2)
Other (.1) .2 –
Effective tax rate 37.8% 38.2% 38.0%
The components of the provision for income taxes were:
Income Tax Provision: Expense
(millions) 2003 2002 2001
Current:
Federal $751 $ 663 $683
State 121 111 107
872 774 790
Deferred:
Federal 219 220 43
State 28 28 6
247 248 49
Total $1,119 $1,022 $839
The components of the net deferred tax asset/(liability) were:
Net Deferred Tax Asset/(Liability)
January 31, February 1,
(millions) 2004 2003
Gross deferred tax assets:
Self-insured benefits $189 $ 188
Deferred compensation 241 184
Inventory 89 106
Accounts receivable valuation allowance 158 151
Postretirement health care obligation 42 42
Other 81 77
800 748
Gross deferred tax liabilities:
Property and equipment (938) (730)
Pension (218) (160)
Other (133) (98)
(1,289) (988)
Total $ (489) $(240)
Other Long-term Liabilities
In addition to deferred taxes discussed above, the major components
of other long-term liabilities at January 31, 2004 and February 1,
2003 included obligations for deferred compensation plan liabilities,
workers’ compensation/general liability costs, property related
liabilities and postretirement health care benefits. The increase in the
other long-term liability balance primarily represents increases in
deferred compensation plan liabilities and workers’ compensation/
general liability costs of $127 million and $34 million, respectively,