Target 2003 Annual Report Download - page 35
Download and view the complete annual report
Please find page 35 of the 2003 Target annual report below. You can navigate through the pages in the report by either clicking on the pages listed below, or by using the keyword search tool below to find specific information within the annual report.-
 1
1 -
2
-
3
-
4
-
5
-
6
-
7
-
8
-
9
-
10
-
11
-
12
-
13
-
14
-
15
-
16
-
17
-
18
-
19
-
20
-
21
-
22
-
23
-
24
-
 25
25 -
 26
26 -
 27
27 -
 28
28 -
 29
29 -
 30
30 -
 31
31 -
 32
32 -
 33
33 -
 34
34 -
 35
35 -
 36
36 -
 37
37 -
 38
38 -
 39
39 -
 40
40 -
 41
41 -
 42
42 -
 43
43 -
 44
44 -
 45
45 -
46
 |
 |

33
We are exposed to claims and litigation arising out of the
ordinary course of business and use various methods to resolve these
matters in a manner that serves the best interest of our shareholders
and other constituents. The dispute resolution methods that we
use include vigorous litigation, when necessary, and alternatives
such as settlement discussions, where appropriate, to reduce the
costs of litigation. Our policy is to fully disclose pending lawsuits
and other known claims that we expect may have a material
impact on our results of operations or financial condition. However,
management, after consulting with legal counsel, does not believe
the currently identified claims and litigation meet this criterion.
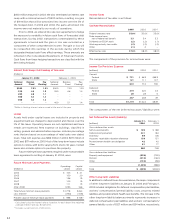
Long-term Debt and Notes Payable
At January 31, 2004, no notes payable were outstanding. The average
amount of secured and unsecured notes payable outstanding
during 2003 was $377 million at a weighted average interest rate
of 1.2 percent. Notes payable balances can fluctuate significantly
during the year due to seasonal financing needs and other factors.
On October 31, 2003, our short-term borrowing reached its highest
level for the year of $1,409 million.
At February 1, 2003, $100 million of notes payable secured by
credit card receivables were outstanding. The average amount of
secured and unsecured notes payable outstanding during 2002 was
$170 million at a weighted average interest rate of 1.9 percent. During
2002, the highest level of short-term borrowing was $735 million.
At January 31, 2004, two committed credit agreements totaling
$1.6 billion were in place through a group of 26 banks at specified
rates. Of these credit lines, an $800 million credit facility expires in
June 2004 and includes a one-year term-out option to June 2005.
The remaining $800 million credit facility expires in June 2008.
There were no balances outstanding at any time during 2003 or
2002 under these agreements.
In 2003, we issued $500 million of long-term debt maturing
in 2008 at 3.38 percent, $200 million of long-term debt maturing
in 2018 at 4.88 percent and $500 million of long-term debt
maturing in 2013 at 4.00 percent. We also called or repurchased
$297 million of long-term debt with an average remaining life of
20 years and a weighted average interest rate of 7.8 percent,
resulting in a loss of $15 million (approximately $.01 per share).
In 2002, we issued $750 million of long-term debt maturing
in 2009 at 5.38 percent, $1 billion of long-term debt maturing in
2012 at 5.88 percent and $600 million of long-term debt maturing
in 2032 at 6.35 percent. Also during 2002, we issued $750 million
of floating rate debt secured by credit card receivables, bearing
interest at an initial rate of 1.99 percent maturing in 2007. We also
called or repurchased $266 million of long-term debt with an
average remaining life of 19 years and a weighted average interest
rate of 8.8 percent, resulting in a loss of $34 million ($.02 per share).
The portion of long-term debt secured by credit card receivables
is $1,500 million at January 31, 2004, $750 million of which matures
in July 2004 and is classified as current portion of long-term debt.
On February 1, 2003, we had $1,900 million of long-term debt
secured by credit card receivables, $400 million of which was
classified as current portion of long-term debt.
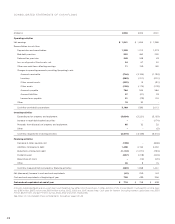
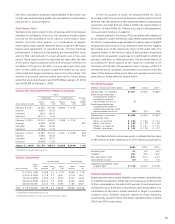
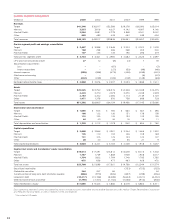
At year-end our debt portfolio, including adjustments related
to swap transactions discussed in the following derivatives section,
was as follows:
Long-term Debt and Notes Payable
January 31, 2004 February 1, 2003
(millions) Rate*Balance Rate*Balance
Notes payable –% $ – 1.4% $ 100
Notes and debentures:
Due 2003-2007 2.8 3,498 3.6 4,396
Due 2008-2012 5.3 4,757 5.8 4,249
Due 2013-2017 4.4 560 7.6 60
Due 2018-2022 5.3 410 9.3 217
Due 2023-2027 6.8 200 7.4 495
Due 2028-2032 6.7 1,500 6.7 1,500
Total notes payable,
notes and debentures** 4.7% $10,925 5.2% $11,017
Capital lease obligations 158 144
Less: current portion (866) (975)
Long-term debt and
notes payable $10,217 $10,186
* Reflects the weighted average stated interest rate as of year-end, including
the impact of interest rate swaps.
** The estimated fair value of total notes payable and notes and debentures,
using a discounted cash flow analysis based on our incremental interest
rates for similar types of financial instruments, was $11,720 million at
January 31, 2004 and $11,741 million at February 1, 2003.
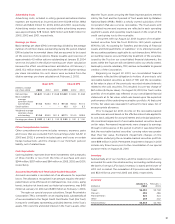
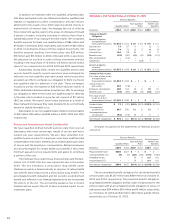
Required principal payments on long-term debt and notes
payable over the next five years, excluding capital lease obligations,
are $857 million in 2004, $502 million in 2005, $752 million in
2006, $1,323 million in 2007 and $1,451 million in 2008.
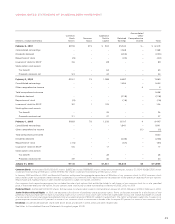
Derivatives
Our derivative instruments are primarily interest rate swaps which
hedge the fair value of certain debt by effectively converting
interest from a fixed rate to a variable rate. We also hold derivative
instruments to manage our exposure to risks associated with the
effect of equity market returns on our non-qualified defined
contribution plans as discussed on page 36.
At January 31, 2004 and February 1, 2003, interest rate swaps
were outstanding in notional amounts totaling $2,150 million and
$1,450 million, respectively. The change in market value of an
interest rate swap as well as the offsetting change in market value
of the hedged debt are recognized into earnings in the current
period. Ineffectiveness results when changes in the market value
of the hedged debt are not completely offset by changes in the
market value of the interest rate swap. There was no ineffectiveness
recognized in 2003 or 2002 related to these instruments. The fair
value of outstanding interest rate swaps and unamortized gains
from terminated interest rate swaps was $97 million at January 31,
2004 and $127 million at February 1, 2003.
During 2003, we entered into interest rate swaps with notional
amounts of $200 million, $500 million and $400 million. We also
terminated an interest rate swap with a notional amount of $400
million, resulting in a gain of $24 million that will be amortized into
income over the life of the hedged debt. During 2002, we entered
into interest rate swaps with notional amounts of $400 million and
$500 million. An interest rate swap with a notional amount of