Target 2003 Annual Report Download - page 40
Download and view the complete annual report
Please find page 40 of the 2003 Target annual report below. You can navigate through the pages in the report by either clicking on the pages listed below, or by using the keyword search tool below to find specific information within the annual report.-
 1
1 -
2
-
3
-
4
-
5
-
6
-
7
-
8
-
9
-
10
-
11
-
12
-
13
-
14
-
15
-
16
-
17
-
18
-
19
-
20
-
21
-
22
-
23
-
24
-
25
-
26
-
27
-
28
-
29
-
 30
30 -
 31
31 -
 32
32 -
 33
33 -
 34
34 -
 35
35 -
 36
36 -
 37
37 -
 38
38 -
 39
39 -
 40
40 -
 41
41 -
 42
42 -
 43
43 -
 44
44 -
 45
45 -
 46
46
 |
 |

38
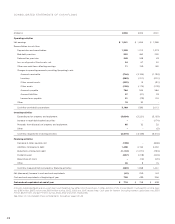
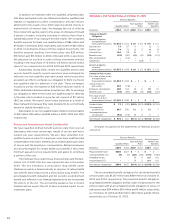
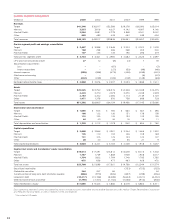
Business Segment Comparisons
(millions) 2003 2002 2001 2000* 1999 1998
Revenues
Target $41,346 $36,917 $32,588 $29,278 $26,080 $23,014
Mervyn’s 3,553 3,816 4,027 4,142 4,087 4,140
Marshall Field’s 2,584 2,691 2,778 2,969 3,041 3,047
Other 680 493 433 462 449 434
Total revenues $48,163 $43,917 $39,826 $36,851 $33,657 $30,635
Pre-tax segment profit and earnings reconciliation
Target $ 3,467 $ 3,088 $ 2,546 $ 2,223 $ 2,022 $ 1,578
Mervyn’s 160 238 286 269 205 240
Marshall Field’s 107 135 133 190 296 279
Total pre-tax segment profit $ 3,734 $ 3,461 $ 2,965 $ 2,682 $ 2,523 $ 2,097
LIFO provision (expense)/credit 27 12 (8) (4) 7 18
Securitization adjustments:
Loss –– (67) – – (3)
Interest equivalent –– (27) (50) (49) (48)
Interest expense (559) (588) (473) (426) (459) (442)
Mainframe outsourcing –– – – (5) (42)
Other (242) (209) (183) (149) (148) (69)
Earnings before income taxes $ 2,960 $ 2,676 $ 2,207 $ 2,053 $ 1,869 $ 1,511
Assets
Target $25,525 $22,752 $18,515 $14,348 $12,048 $10,475
Mervyn’s 2,243 2,270 2,379 2,270 2,248 2,339
Marshall Field’s 2,153 2,202 2,284 2,114 2,149 2,123
Other 1,471 1,379 976 758 698 729
Total assets $31,392 $28,603 $24,154 $ 19,490 $17,143 $15,666
Depreciation and amortization
Target $ 1,055 $ 925 $ 784 $ 660 $ 567 $ 496
Mervyn’s 106 122 126 131 138 138
Marshall Field’s 115 125 135 133 133 135
Other 44 40 34 16 16 11
Total depreciation and amortization $ 1,320 $ 1,212 $ 1,079 $ 940 $ 854 $ 780
Capital expenditures
Target $ 2,690 $ 2,966 $ 2,901 $ 2,244 $ 1,665 $ 1,352
Mervyn’s 145 110 104 106 108 169
Marshall Field’s 141 105 125 143 124 127
Other 28 40 33 35 21 9
Total capital expenditures $ 3,004 $ 3,221 $ 3,163 $ 2,528 $ 1,918 $ 1,657
Segment net assets and shareholders’ equity reconciliation
Target $19,514 $17,491 $13,812 $10,659 $ 8,413 $ 7,302
Mervyn’s 1,757 1,749 1,868 1,928 1,908 2,017
Marshall Field’s 1,754 1,822 1,764 1,749 1,795 1,785
Other 675 636 477 463 428 470
Total net assets $23,700 $21,698 $17,921 $ 14,799 $12,544 $11,574
Securitized receivables –– – (753) (753) (753)
Marketable securities 244 357 84 – – 44
Current portion of long-term debt and notes payable (866) (975) (905) (857) (498) (256)
Long-term debt (10,217) (10,186) (8,088) (5,634) (4,521) (4,452)
Deferred income taxes and other (1,796) (1,451) (1,152) (1,036) (910) (846)
Total shareholders’ equity $11,065 $ 9,443 $ 7,860 $ 6,519 $ 5,862 $ 5,311
Each operating segment’s assets and operating results include accounts receivable and receivable-backed securities held by Target Receivables Corporation
and Retailers National Bank, as well as related income and expense.
*Consisted of 53 weeks.