Target 2003 Annual Report Download - page 21
Download and view the complete annual report
Please find page 21 of the 2003 Target annual report below. You can navigate through the pages in the report by either clicking on the pages listed below, or by using the keyword search tool below to find specific information within the annual report.-
 1
1 -
2
-
3
-
4
-
5
-
6
-
7
-
8
-
9
-
10
-
 11
11 -
 12
12 -
 13
13 -
 14
14 -
 15
15 -
 16
16 -
 17
17 -
 18
18 -
 19
19 -
 20
20 -
 21
21 -
 22
22 -
 23
23 -
 24
24 -
 25
25 -
 26
26 -
 27
27 -
 28
28 -
 29
29 -
 30
30 -
 31
31 -
32
-
33
-
34
-
35
-
36
-
37
-
38
-
39
-
40
-
41
-
42
-
43
-
44
-
45
-
46
 |
 |
19
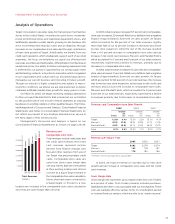
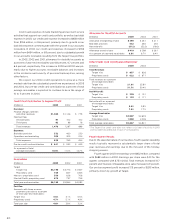
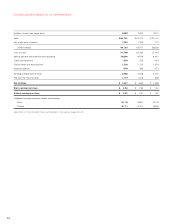
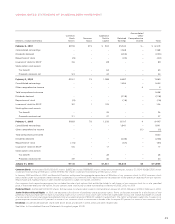
Pre-tax Segment Profit and as a Percent of Revenues
Pre-tax Segment Profit As a Percent of Revenues
(millions) 2003 2002 2001 2003 2002 2001
Target $3,467 $3,088 $2,546 8.4% 8.4% 7.8%
Mervyn’s 160 238 286 4.5 6.2 7.1
Marshall Field’s 107 135 133 4.1 5.0 4.8
Total pre-tax
segment
profit $3,734 $3,461 $2,965 7.9% 8.0% 7.5%
Securitization
adjustments:
Loss –– (67)
Interest
equivalent –– (27)
LIFO provision
credit/(expense) 27 12 (8)
Interest expense (559) (588) (473)
Other (242) (209) (183)
Earnings
before taxes $2,960 $2,676 $2,207
In 2001, the $67 million pre-tax loss related to the required adoption of a
new accounting standard applicable to securitized accounts receivable. The
$27 million interest equivalent represented payments accrued to holders of
sold securitized receivables prior to August 22, 2001 (discussed in detail in
the Notes to Consolidated Financial Statements under Accounts Receivable
and Receivable-backed Securities on page 31).
Interest Expense
In 2003, interest expense was $559 million, $29 million lower than
in 2002. The decrease was due to a lower average portfolio interest
rate and a smaller loss on debt called or repurchased, partially
offset by higher average debt outstanding. The average portfolio
interest rate in 2003 was 4.9 percent compared with 5.6 percent
in 2002. The $297 million of debt called or repurchased during
2003 resulted in a loss of $15 million (approximately $.01 per share)
and had an average interest rate of 7.8 percent and an average
remaining life of 20 years.
In 2002, interest expense was $588 million, $88 million higher
than the total of interest expense and interest equivalent in 2001.
The increase was due to higher average debt outstanding and a
greater loss on the early call or repurchase of debt, partially offset
by a lower average portfolio interest rate. The average portfolio
interest rate in 2002 was 5.6 percent compared with 6.4 percent
in 2001. (For analytical purposes, the amounts that represented
payments accrued to holders of sold securitized receivables prior
to August 22, 2001 were considered interest equivalent as discussed
in the Notes to Consolidated Financial Statements on page 31.
After that date, such payments constituted interest expense.) In
2002 and 2001, we incurred losses of $34 million ($.02 per share)
and $9 million (less than $.01 per share) from the early call or
repurchase of $266 million and $144 million of debt, respectively.
The debt called or repurchased had an average interest rate of
8.8 percent and 9.2 percent, respectively, and had an average
remaining life of 19 years and 7 years, respectively.
We adopted SFAS No. 145, “Rescission of FASB Statements
No. 4, 44 and 64, Amendment of FASB Statement No. 13 and
Technical Corrections” in the first quarter of 2002. Under SFAS
No. 145, gains and losses from the early extinguishment of debt are
required to be included in interest expense and are not reflected
as an extraordinary item. Prior year extraordinary items have been
reclassified to reflect this change. The adoption of SFAS No. 145
had no impact on net earnings, cash flows or financial position.
The requirements of SFAS No. 145 are discussed under New
Accounting Pronouncements on page 25.
Excluding the effect of any early call or repurchase of debt,
we expect interest expense in 2004 to remain essentially flat to
2003, as average debt outstanding and the average portfolio
interest rate are not expected to change significantly.
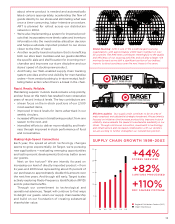
Credit Card Operations
Through our proprietary store-brand credit card programs, some
of which have been available for decades, and our Target Visa credit
card that was introduced nationally in 2001, we offer credit to
qualified guests in each of our business segments. Our credit card
programs strategically support our core retail operations and are
an integral component of each business segment. Our credit card
products support earnings growth by driving sales at our stores
and through improvements in our credit card financial performance.
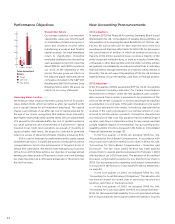
Our credit card revenues are primarily derived from finance
charges, late fees and other revenues. Intracompany merchant fees
are fees charged to our retail operations on a basis similar to fees
charged by third-party credit card issuers. These fees are eliminated
in consolidation. Third-party merchant fees are paid to us by
merchants that have accepted the Target Visa credit card. In 2003,
our credit card revenues increased to $1,479 million from $1,297
million, or 14 percent, due to continued growth in the Target Visa
credit card portfolio. In 2002, our credit card revenues increased
to $1,297 million from $899 million, or 44 percent, due primarily to
additional revenues earned from the Target Visa credit card portfolio.
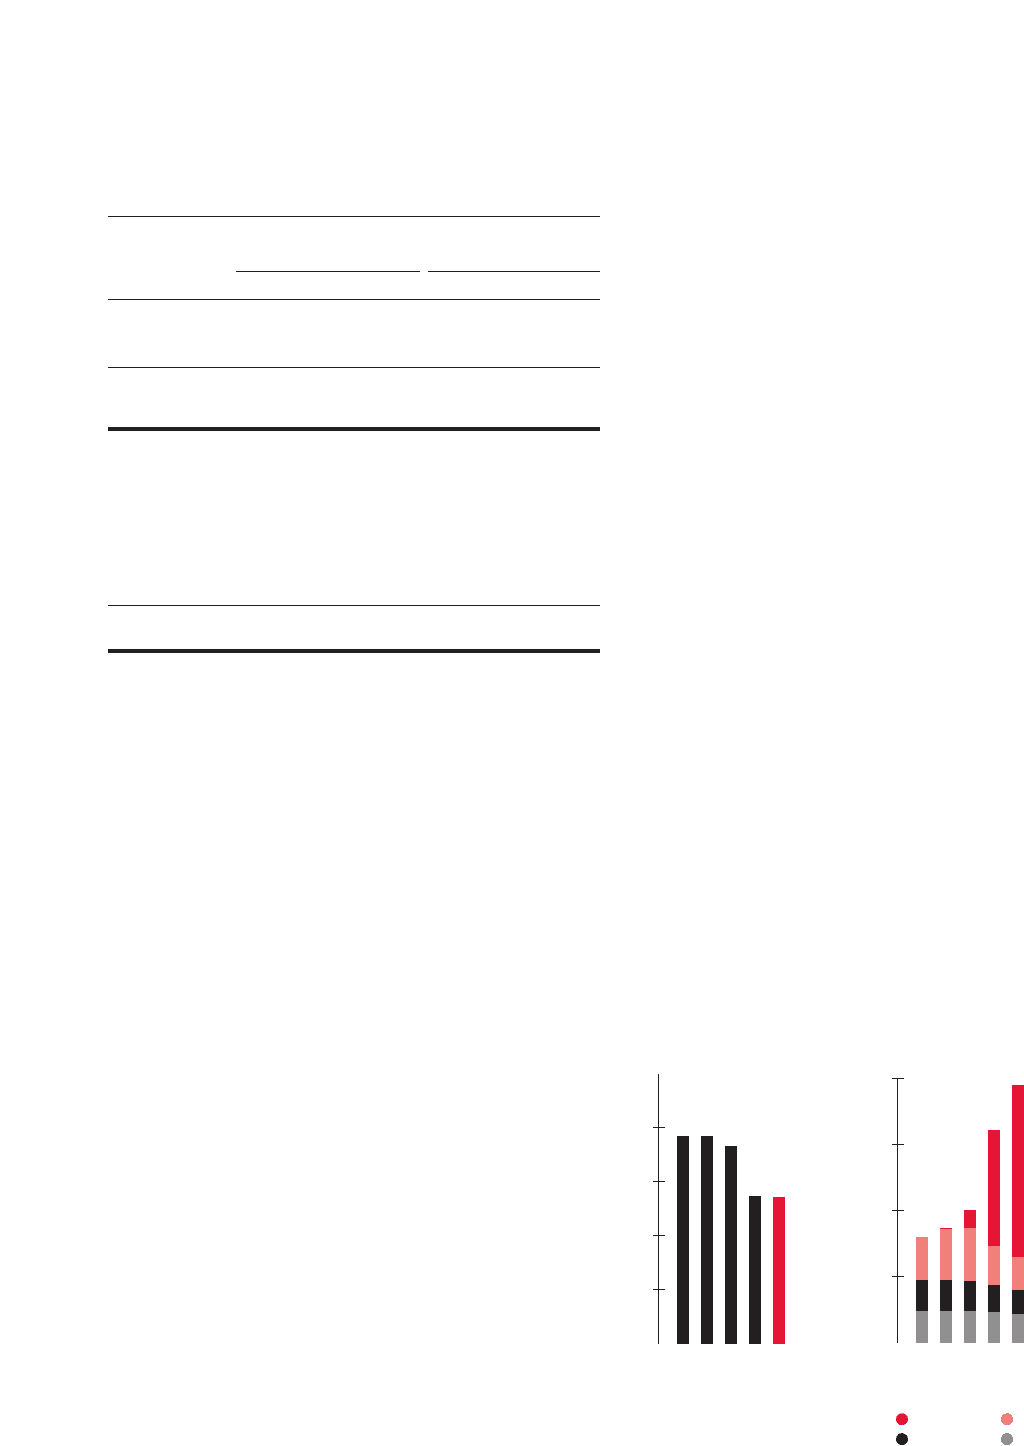
’99 ’00 ’01 ’02 ’03
15.4%
15.4%
14.7%
11.0%
10.9%
16
8
12
4
Credit Portfolio
Yield
’99 ’00 ’01 ’02 ’03
$4,500
$6,000
$3,000
$1,500
Average Receivables
(millions)
Target Visa Target Guest Card
Mervyn’s Marshall Field’s