Target 2003 Annual Report Download - page 25
Download and view the complete annual report
Please find page 25 of the 2003 Target annual report below. You can navigate through the pages in the report by either clicking on the pages listed below, or by using the keyword search tool below to find specific information within the annual report.-
 1
1 -
2
-
3
-
4
-
5
-
6
-
7
-
8
-
9
-
10
-
11
-
12
-
13
-
14
-
 15
15 -
 16
16 -
 17
17 -
 18
18 -
 19
19 -
 20
20 -
 21
21 -
 22
22 -
 23
23 -
 24
24 -
 25
25 -
 26
26 -
 27
27 -
 28
28 -
 29
29 -
 30
30 -
 31
31 -
 32
32 -
 33
33 -
 34
34 -
 35
35 -
36
-
37
-
38
-
39
-
40
-
41
-
42
-
43
-
44
-
45
-
46
 |
 |

23
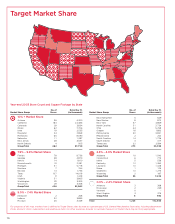
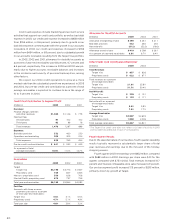
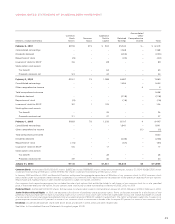
Number of Stores
February 1, January 31,
2003 Opened Closed 2004
Target*1,147 101 23 1,225
Mervyn’s 264 3 1 266
Marshall Field’s 64 – 2 62
Total 1,475 104 26 1,553
* Target includes 118 and 94 SuperTargets at January 31, 2004 and February 1,
2003, respectively.
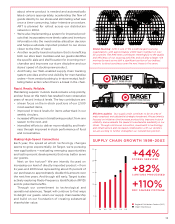
In 2004, we expect to invest $3.2 billion to $3.4 billion, mostly
in new square footage for Target stores and the distribution
infrastructure and systems to support this growth. Our estimated
2004 store opening program at Target reflects net square footage
growth of approximately 8 to 9 percent, or 95 to 100 total new
stores partially offset by closings and relocations. In addition, we
expect to remodel approximately 70 stores in 2004.
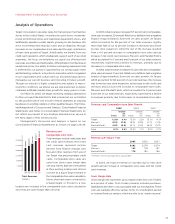
Owned and Leased Store Locations
At year-end 2003, owned, leased and “combined” (generally an
owned building on leased land) store locations by operating seg-
ment were as follows:
Owned Leased Combined Total
Target 987 87 151 1,225
Mervyn’s 155 62 49 266
Marshall Field’s 49 11 2 62
Total 1,191 160 202 1,553
Commitments and Contingencies
At January 31, 2004, our debt, lease and royalty contractual obli-
gations were as follows:
Payments Due by Period
(millions) Less than 1-3 3-5 After 5
Contractual Obligations Total 1 Year Years Years Years
Long-term debt*$10,828 $ 857 $1,254 $2,774 $ 5,943
Interest payments** 6,062 587 1,103 912 3,460
Capital lease
obligations*** 264 21 39 38 166
Operating leases*** 1,778 163 286 236 1,093
Royalties 80 42 38 – –
Contractual cash
obligations $19,012 $1,670 $2,720 $3,960 $10,662
*Required principal payments only. Excludes SFAS No. 133, “Accounting
for Derivative Instruments and Hedging Activities,” fair market value
adjustments recorded in long-term debt.
** Includes payments on $1.5 billion of floating rate long-term debt secured
by credit card receivables, of which $750 million matures in July 2004 and
$750 million matures in 2007. These payments are calculated assuming
rates of 1.25%, 2.25%, 3.25% and 4.25% for 2004, 2005, 2006 and 2007,
respectively. Excludes payments received or made relating to interest rate
swaps discussed on pages 33-34.
*** Total contractual lease payments.
Commitments for the purchase, construction, lease or remodel-
ing of real estate, facilities and equipment were approximately
$545 million at year-end 2003.
Throughout the year, we enter into various commitments to
purchase inventory. In addition to the accounts payable reflected in
our Statements of Financial Position on page 27, we had commit-
ments with various vendors for the purchase of inventory as of
January 31, 2004. The previous table excludes these commitments
because these purchase commitments are cancelable by their terms.
Legal Proceedings
We are exposed to claims and litigation arising out of the ordinary
course of business and use various methods to resolve those matters
in a manner that serves the best interest of our shareholders and
other constituents. The dispute resolution methods that we use
include vigorous litigation, when necessary, and alternatives such
as settlement discussions, where appropriate, to reduce the costs
of litigation. Our policy is to fully disclose pending lawsuits and
other known claims that we expect may have a material impact
on our results of operations or financial condition. After consulting
with legal counsel, management does not believe that any currently
identified claims or litigation meet this criterion.
Market Risk
Our exposure to market risk results primarily from fluctuations in
interest rates on our debt obligations and from the effect of equity
market returns on our non-qualified defined contribution plans.
We hold derivative instruments primarily to manage our exposure
to these risks and all derivative instruments are matched against
specific debt obligations or other liabilities. There have been no
material changes in the primary risk exposures or management of
the risks since the prior year. Our debt and interest rate swap
instruments outstanding at January 31, 2004, including applicable
interest rates, are discussed in the Notes to Consolidated Financial
Statements on pages 33-34.
The annualized effect of a one percentage point change in
floating interest rates on our interest rate swap agreements and
other floating rate debt obligations at January 31, 2004, would be
to change interest expense by approximately $36 million. The
annualized effect of a one percentage point change in equity market
returns on our non-qualified defined contribution plans (inclusive
of the effect of derivative instruments used to hedge or manage
these exposures) would not be significant.