Target 2003 Annual Report Download - page 2
Download and view the complete annual report
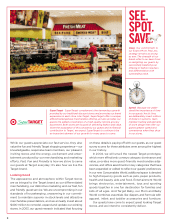
Please find page 2 of the 2003 Target annual report below. You can navigate through the pages in the report by either clicking on the pages listed below, or by using the keyword search tool below to find specific information within the annual report.-
 1
1 -
 2
2 -
 3
3 -
 4
4 -
 5
5 -
 6
6 -
 7
7 -
 8
8 -
 9
9 -
 10
10 -
 11
11 -
 12
12 -
 13
13 -
14
-
15
-
16
-
17
-
18
-
19
-
20
-
21
-
22
-
23
-
24
-
25
-
26
-
27
-
28
-
29
-
30
-
31
-
32
-
33
-
34
-
35
-
36
-
37
-
38
-
39
-
40
-
41
-
42
-
43
-
44
-
45
-
46
 |
 |

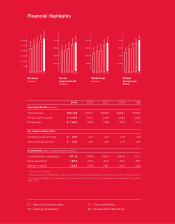
2003 2002 2001 2000*1999
Operating Results (millions)
Total revenues $48,163 43,917 39,826 36,851 33,657
Pre-tax segment profit $ 3,734 3,461 2,965 2,682 2,523
Net earnings $ 1,841 1,654 1,368 1,264 1,144
Per Common Share Data**
Diluted earnings per share $2.01 1.81 1.50 1.38 1.23
Cash dividends declared $ .270 .240 .225 .215 .200
At Year-end (millions, except Number of stores)
Common shares outstanding 911.8 909.8 905.2 897.8 911.7
Retail square feet 188.6 176.5 161.6 149.4 139.4
Number of stores 1,553 1,475 1,381 1,307 1,243
* Consisted of 53 weeks.
** Earnings per share, dividends per share and common shares outstanding reflect our 2000 two-for-one common share split.
The Financial Highlights should be read in conjunction with the Notes to Consolidated Financial Statements throughout
page 30-39.
01 Report to Shareholders
04 Strategy Discussion
17 Financial Review
42 Shareholder Information
Net Earnings
(millions)
Pre-tax
Segment Profit
(millions)
Financial Highlights
Revenues
(millions)
Diluted
Earnings per
Share
’99 ’00 ’01 ’02 ’03
$33,657
$36,851
$39,826
$43,917
$48,163
45,000
37,500
30,000
22,500
15,000
7,500
’99 ’00 ’01 ’02 ’03
$2,523
$2,682
$2,965
$3,461
$3,734
4,000
3,000
2,000
1,000
’99 ’00 ’01 ’02 ’03
$1,144
$1,264
$1,368
$1,654
$1,841
2,000
1,500
1,000
500
’99 ’00 ’01 ’02 ’03
$1.23
$1.38
$1.50
$1.81
$2.01
2.00
1.50
1.00
0.50