Target 2006 Annual Report Download - page 17
Download and view the complete annual report
Please find page 17 of the 2006 Target annual report below. You can navigate through the pages in the report by either clicking on the pages listed below, or by using the keyword search tool below to find specific information within the annual report.-
 1
1 -
2
-
3
-
4
-
5
-
6
-
 7
7 -
 8
8 -
 9
9 -
 10
10 -
 11
11 -
 12
12 -
 13
13 -
 14
14 -
 15
15 -
 16
16 -
 17
17 -
 18
18 -
 19
19 -
 20
20 -
 21
21 -
 22
22 -
 23
23 -
 24
24 -
 25
25 -
 26
26 -
 27
27 -
28
-
29
-
30
-
31
-
32
-
33
-
34
-
35
-
36
-
37
-
38
-
39
-
40
-
41
-
42
-
43
-
44
-
45
-
46
-
47
-
48
-
49
-
50
-
51
-
52
-
53
-
54
-
55
-
56
-
57
-
58
-
59
-
60
-
61
-
62
-
63
-
64
-
65
-
66
-
67
-
68
-
69
-
70
-
71
-
72
-
73
-
74
-
75
-
76
 |
 |

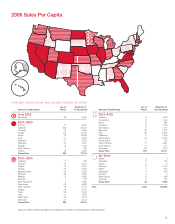
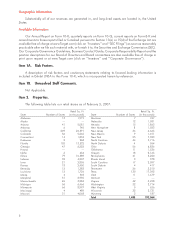
15
No. of Retail Sq. Ft.
Sales per Capita Group Stores (in thousands)
Over $300
Minnesota 66 8,997
$201–$300
Arizona 41 5,081
California 209 26,391
Colorado 36 5,265
Florida 102 13,532
Illinois 79 10,589
Iowa 21 2,855
Maryland 31 3,935
Nebraska 12 1,581
Nevada 15 1,863
North Dakota 4 554
Virginia 42 5,498
Group Total 592 77,144
$151–$200
Delaware 2 268
Georgia 47 6,222
Indiana 32 4,207
Kansas 18 2,450
Massachusetts 26 3,284
Michigan 56 6,466
Missouri 31 4,068
Montana 7 767
New Hampshire 8 1,023
New Jersey 36 4,666
North Carolina 44 5,716
Oregon 18 2,166
Texas 130 17,392
Utah 11 1,679
Washington 32 3,714
Wisconsin 32 3,731
Group Total 530 67,819
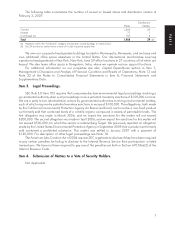
No. of Retail Sq. Ft.
Sales per Capita Group Stores (in thousands)
$101–$150
Alabama 13 1,919
Connecticut 14 1,834
Idaho 6 664
Louisiana 12 1,726
New Mexico 9 1,011
New York 55 7,323
Ohio 56 6,836
Oklahoma 11 1,536
Pennsylvania 41 5,220
Rhode Island 3 378
South Carolina 17 2,097
South Dakota 4 417
Tennessee 26 3,210
Group Total 267 34,171
$0–$100
Alaska 0 0
Arkansas 6 745
Hawaii 0 0
Kentucky 12 1,383
Maine 4 503
Mississippi 4 489
Vermont 0 0
West Virginia 5 626
Wyoming 2 187
Group Total 33 3,933
Total 1,488 192,064
YEAR-END STORE COUNT AND SQUARE FOOTAGE BY STATE
Sales per capita is defined as sales by state (based on 52 weeks of sales) divided by state population.
2006 Sales Per Capita