Target 2006 Annual Report Download - page 33
Download and view the complete annual report
Please find page 33 of the 2006 Target annual report below. You can navigate through the pages in the report by either clicking on the pages listed below, or by using the keyword search tool below to find specific information within the annual report.-
 1
1 -
2
-
3
-
4
-
5
-
6
-
7
-
8
-
9
-
10
-
11
-
12
-
13
-
14
-
15
-
16
-
17
-
18
-
19
-
20
-
21
-
22
-
 23
23 -
 24
24 -
 25
25 -
 26
26 -
 27
27 -
 28
28 -
 29
29 -
 30
30 -
 31
31 -
 32
32 -
 33
33 -
 34
34 -
 35
35 -
 36
36 -
 37
37 -
 38
38 -
 39
39 -
 40
40 -
 41
41 -
 42
42 -
 43
43 -
44
-
45
-
46
-
47
-
48
-
49
-
50
-
51
-
52
-
53
-
54
-
55
-
56
-
57
-
58
-
59
-
60
-
61
-
62
-
63
-
64
-
65
-
66
-
67
-
68
-
69
-
70
-
71
-
72
-
73
-
74
-
75
-
76
 |
 |

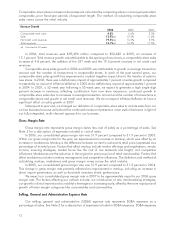
Depreciation and Amortization
During 2006, we adjusted the period over which we amortize leasehold acquisition costs to match the
expected terms for individual leases, resulting in a cumulative benefit to depreciation and amortization
expense of approximately $28 million. This change reduced depreciation and amortization expense during
2006, when depreciation and amortization expense totaled $1,496 million, compared to $1,409 million in
2005, an increase of 6.1 percent. In 2005, depreciation and amortization expense increased 11.9 percent,
in line with our sales growth for the year, to $1,409 million. We expect 2007 depreciation and amortization
expense to be approximately $1.7 billion.
Net Interest Expense
In 2006, net interest expense was $572 million compared to $463 million in 2005, an increase of
23.4 percent. This increase related primarily to growth in the cost of funding our credit card operations and
was also unfavorably impacted by the 53rd week in the current fiscal year. The average portfolio interest rate
was 6.2 percent in 2006 and 5.9 percent in 2005.
In 2005, net interest expense was $463 million, compared to $570 million in 2004. This decrease was
primarily due to a significantly smaller loss on debt repurchase in 2005 (less than $1 million in 2005
compared to $89 million in 2004). The decrease in 2005 net interest expense also reflected the benefit of
lower average net debt in the first half of the year due to the application of proceeds from the mid-2004
Marshall Field’s and Mervyn’s sale transactions. This benefit was partially offset by higher average net debt
balances in the second half of the year and a higher annual average portfolio interest rate. For the full year,
the average portfolio interest rate was 5.9 percent in 2005 and 5.5 percent in 2004.
Our 2007 net interest expense is expected to increase due to modestly higher average net debt. To
preserve our net interest margin on our receivables, we intend to maintain a sufficient level of floating-rate
debt to generate parallel changes in net interest expense and finance charge revenue.
Provision for Income Taxes
Our effective income tax rate from continuing operations was 38.0 percent in 2006, 37.6 percent in
2005 and 37.8 percent in 2004. Our lower 2005 effective rate was due to the favorable resolution of
various tax matters in 2005. We expect our effective income tax rate in 2007 to rise modestly from 2006.
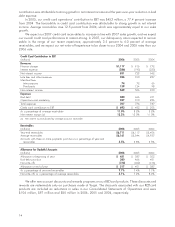
Analysis of Financial Condition
Liquidity and Capital Resources
Our financial condition remains strong. In assessing our financial condition, we consider factors such
as cash flow provided by operations, capital expenditures and debt service obligations. Cash flow provided
by operations was $4,862 million in 2006 compared to $4,451 million in 2005, primarily due to higher
earnings from continuing operations.
We continue to fund our growth and execute our share repurchase program through a combination of
internally-generated funds and debt financing.
Our year-end gross receivables were $6,711 million compared to $6,117 million in 2005, an
increase of 9.7 percent. This growth was driven by increased issuance and usage of the Target Visa credit
card by our guests during 2006. Average receivables in 2006 increased 11.1 percent. In 2007 we expect
our credit card receivables to grow in line with our 2007 sales.
Year-end inventory levels increased $416 million, or 7.1 percent, reflecting the natural increase
required to support additional square footage and comparable-store sales growth. This growth was largely
funded by an increase in accounts payable over the same period.
In June 2004, our Board of Directors authorized the repurchase of $3 billion of our common stock. In
November 2005, our Board increased the aggregate authorization by $2 billion for a total authorization of
$5 billion. In 2006, we repurchased 19.5 million shares of our common stock for a total investment of
$977 million ($50.16 per share), primarily through open market transactions. Since the inception of this
15
PART II