Target 2006 Annual Report Download - page 28
Download and view the complete annual report
Please find page 28 of the 2006 Target annual report below. You can navigate through the pages in the report by either clicking on the pages listed below, or by using the keyword search tool below to find specific information within the annual report.-
 1
1 -
2
-
3
-
4
-
5
-
6
-
7
-
8
-
9
-
10
-
11
-
12
-
13
-
14
-
15
-
16
-
17
-
 18
18 -
 19
19 -
 20
20 -
 21
21 -
 22
22 -
 23
23 -
 24
24 -
 25
25 -
 26
26 -
 27
27 -
 28
28 -
 29
29 -
 30
30 -
 31
31 -
 32
32 -
 33
33 -
 34
34 -
 35
35 -
 36
36 -
 37
37 -
 38
38 -
39
-
40
-
41
-
42
-
43
-
44
-
45
-
46
-
47
-
48
-
49
-
50
-
51
-
52
-
53
-
54
-
55
-
56
-
57
-
58
-
59
-
60
-
61
-
62
-
63
-
64
-
65
-
66
-
67
-
68
-
69
-
70
-
71
-
72
-
73
-
74
-
75
-
76
 |
 |

10MAR200717430724
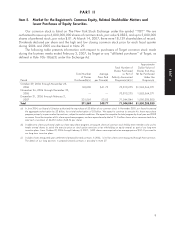
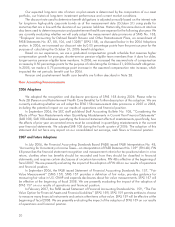
Comparision of Cumulative Five Year Total Return
50
100
150 Peer Group
S&P 500 Index
Target
2002 2003 2004 2005 2006 2007
Dollars ($)
Fiscal Years Ended
February 2, February 1, January 31, January 29, January 28, February 3,
2002 2003 2004 2005 2006 2007
Target $100.00 $65.49 $ 88.76 $119.49 $129.74 $148.22
S&P 500 Index $100.00 $77.54 $104.34 $110.84 $122.35 $141.09
Peer Group $100.00 $73.98 $ 97.26 $105.61 $108.82 $123.01
The graph above compares the cumulative total shareholder return on our common stock for the last
five fiscal years with the cumulative total return on the S&P 500 Index and a peer group consisting of the
companies comprising the S&P 500 Retailing Index and the S&P 500 Food and Staples Retailing Index (Peer
Group) over the same period. The Peer Group index consists of 38 general merchandise, food and drug
retailers and is weighted by the market capitalization of each component company. The graph assumes the
investment of $100 in Target common stock, the S&P 500 Index and the Peer Group on February 2, 2002
and reinvestment of all dividends.
10