Target 2006 Annual Report Download - page 29
Download and view the complete annual report
Please find page 29 of the 2006 Target annual report below. You can navigate through the pages in the report by either clicking on the pages listed below, or by using the keyword search tool below to find specific information within the annual report.-
 1
1 -
2
-
3
-
4
-
5
-
6
-
7
-
8
-
9
-
10
-
11
-
12
-
13
-
14
-
15
-
16
-
17
-
18
-
 19
19 -
 20
20 -
 21
21 -
 22
22 -
 23
23 -
 24
24 -
 25
25 -
 26
26 -
 27
27 -
 28
28 -
 29
29 -
 30
30 -
 31
31 -
 32
32 -
 33
33 -
 34
34 -
 35
35 -
 36
36 -
 37
37 -
 38
38 -
 39
39 -
40
-
41
-
42
-
43
-
44
-
45
-
46
-
47
-
48
-
49
-
50
-
51
-
52
-
53
-
54
-
55
-
56
-
57
-
58
-
59
-
60
-
61
-
62
-
63
-
64
-
65
-
66
-
67
-
68
-
69
-
70
-
71
-
72
-
73
-
74
-
75
-
76
 |
 |

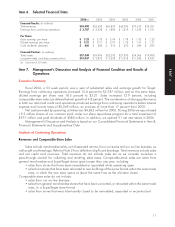
Item 6. Selected Financial Data.
2006(a) 2005 2004 2003 2002 2001
Financial Results: (in millions)
Total revenues $59,490 $52,620 $46,839 $42,025 $37,410 $33,021
Earnings from continuing operations $ 2,787 $ 2,408 $ 1,885 $ 1,619 $ 1,376 $ 1,101
Per Share:
Basic earnings per share $ 3.23 $ 2.73 $ 2.09 $ 1.78 $ 1.52 $ 1.22
Diluted earnings per share $ 3.21 $ 2.71 $ 2.07 $ 1.76 $ 1.51 $ 1.21
Cash dividends declared $ .460 $ .380 $ .310 $ .270 $ .240 $ .225
Financial Position: (in millions)
Total assets $37,349 $34,995 $32,293 $27,390 $24,506 $19,808
Long-term debt, including current portion $10,037 $ 9,872 $ 9,538 $11,018 $11,090 $ 8,957
(a) Consisted of 53 weeks.
Item 7. Management’s Discussion and Analysis of Financial Condition and Results of
Operations.
Executive Summary
Fiscal 2006, a 53 week period, was a year of substantial sales and earnings growth for Target.
Earnings from continuing operations increased 15.8 percent to $2,787 million, and on this same basis,
diluted earnings per share rose 18.5 percent to $3.21. Sales increased 12.9 percent, including
comparable-store sales (as defined below) growth of 4.8 percent. The combination of strong performance
in both our retail and credit card operations produced earnings from continuing operations before interest
expense and income taxes of $5,069 million, an increase of more than 17 percent from 2005.
Net cash provided by operating activities was $4,862 million for 2006. During 2006 we repurchased
19.5 million shares of our common stock under our share repurchase program for a total investment of
$977 million and paid dividends of $380 million. In addition, we opened 91 net new stores in 2006.
Management’s Discussion and Analysis is based on our Consolidated Financial Statements in Item 8,
Financial Statements and Supplementary Data.
Analysis of Continuing Operations
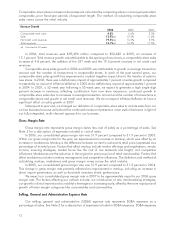
Revenues and Comparable-Store Sales
Sales include merchandise sales, net of expected returns, from our stores and our on-line business, as
well as gift card breakage. Refer to Note 2 for a definition of gift card breakage. Total revenues include sales
and net credit card revenues. Total revenues do not include sales tax as we consider ourselves a
pass-through conduit for collecting and remitting sales taxes. Comparable-store sales are sales from
general merchandise and SuperTarget stores open longer than one year, including:
• sales from stores that have been remodeled or expanded while remaining open
• sales from stores that have been relocated to new buildings of the same format within the same trade
area, in which the new store opens at about the same time as the old store closes
Comparable-store sales do not include:
• sales from our on-line business
• sales from general merchandise stores that have been converted, or relocated within the same trade
area, to a SuperTarget store format
• sales from stores that were intentionally closed to be remodeled, expanded or reconstructed
11
PART II