Target 2006 Annual Report Download - page 45
Download and view the complete annual report
Please find page 45 of the 2006 Target annual report below. You can navigate through the pages in the report by either clicking on the pages listed below, or by using the keyword search tool below to find specific information within the annual report.-
 1
1 -
2
-
3
-
4
-
5
-
6
-
7
-
8
-
9
-
10
-
11
-
12
-
13
-
14
-
15
-
16
-
17
-
18
-
19
-
20
-
21
-
22
-
23
-
24
-
25
-
26
-
27
-
28
-
29
-
30
-
31
-
32
-
33
-
34
-
 35
35 -
 36
36 -
 37
37 -
 38
38 -
 39
39 -
 40
40 -
 41
41 -
 42
42 -
 43
43 -
 44
44 -
 45
45 -
 46
46 -
 47
47 -
 48
48 -
 49
49 -
 50
50 -
 51
51 -
 52
52 -
 53
53 -
 54
54 -
 55
55 -
56
-
57
-
58
-
59
-
60
-
61
-
62
-
63
-
64
-
65
-
66
-
67
-
68
-
69
-
70
-
71
-
72
-
73
-
74
-
75
-
76
 |
 |

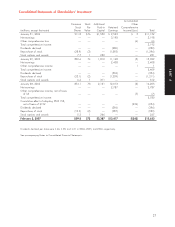
Consolidated Statements of Shareholders’ Investment
Accumulated
Common Stock Additional Other
Stock Par Paid-in Retained Comprehensive
(millions, except footnotes) Shares Value Capital Earnings Income/(Loss) Total
January 31, 2004 911.8 $76 $1,530 $ 9,523 $ 3 $11,132
Net earnings — — — 3,198 — 3,198
Other comprehensive loss — — — — (6) (6)
Total comprehensive income 3,192
Dividends declared — — — (280) — (280)
Repurchase of stock (28.9) (3) — (1,293) — (1,296)
Stock options and awards 7.7 1 280 — — 281
January 29, 2005 890.6 74 1,810 11,148 (3) 13,029
Net earnings — — — 2,408 — 2,408
Other comprehensive income — — — — 1 1
Total comprehensive income 2,409
Dividends declared — — — (334) — (334)
Repurchase of stock (23.1) (2) — (1,209) — (1,211)
Stock options and awards 6.6 1 311 — — 312
January 28, 2006 874.1 73 2,121 12,013 (2) 14,205
Net earnings — — — 2,787 — 2,787
Other comprehensive income, net of taxes
of $5 — — — — (7) (7)
Total comprehensive income 2,780
Cumulative effect of adopting SFAS 158,
net of taxes of $152 — — — — (234) (234)
Dividends declared — — — (396) — (396)
Repurchase of stock (19.5) (2) — (987) — (989)
Stock options and awards 5.2 1 266 — — 267
February 3, 2007 859.8 $72 $2,387 $13,417 $(243) $15,633
Dividends declared per share were $.46, $.38, and $.31 in 2006, 2005, and 2004, respectively.
See accompanying Notes to Consolidated Financial Statements.
27
PART II