Target 2006 Annual Report Download - page 2
Download and view the complete annual report
Please find page 2 of the 2006 Target annual report below. You can navigate through the pages in the report by either clicking on the pages listed below, or by using the keyword search tool below to find specific information within the annual report.-
 1
1 -
 2
2 -
 3
3 -
 4
4 -
 5
5 -
 6
6 -
 7
7 -
 8
8 -
 9
9 -
 10
10 -
 11
11 -
 12
12 -
 13
13 -
14
-
15
-
16
-
17
-
18
-
19
-
20
-
21
-
22
-
23
-
24
-
25
-
26
-
27
-
28
-
29
-
30
-
31
-
32
-
33
-
34
-
35
-
36
-
37
-
38
-
39
-
40
-
41
-
42
-
43
-
44
-
45
-
46
-
47
-
48
-
49
-
50
-
51
-
52
-
53
-
54
-
55
-
56
-
57
-
58
-
59
-
60
-
61
-
62
-
63
-
64
-
65
-
66
-
67
-
68
-
69
-
70
-
71
-
72
-
73
-
74
-
75
-
76
 |
 |
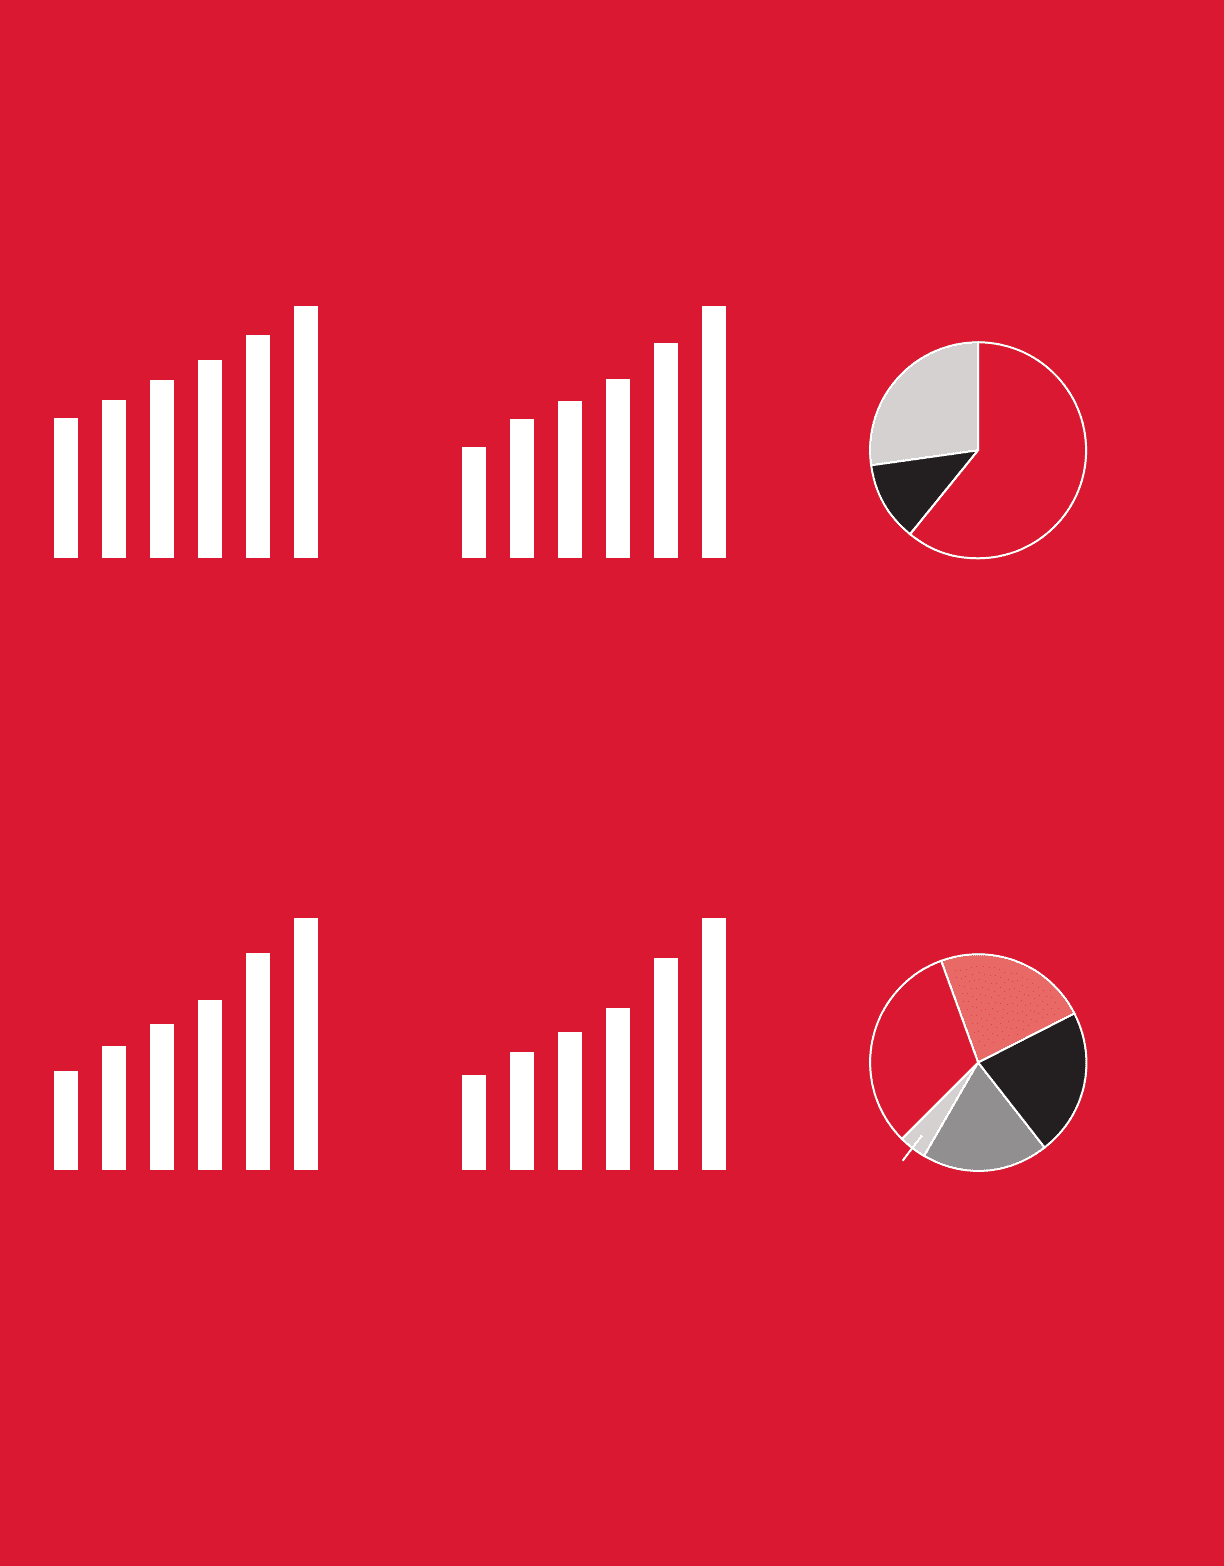
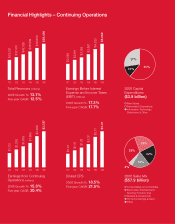
Financial Highlights – Continuing Operations
’01 ’02 ’03 ’04 ’05
$33,021
$37,410
$42,025
$46,839
$52,620
Total Revenues (millions)
2006 Growth %: 13.1%
Five-year CAGR: 12.5%
’01 ’02 ’03 ’04 ’05
$2,246
$2,811
$3,159
$3,601
$4,323
Earnings Before Interest
Expense and Income Taxes
(EBIT) (millions)
2006 Growth %: 17.3%
Five-year CAGR: 17.7%
’01 ’02 ’03 ’04 ’05
$1,101
$1,376
$1,619
$1,885
$2,408
Earnings from Continuing
Operations (millions)
2006 Growth %: 15.8%
Five-year CAGR: 20.4%
’01 ’02 ’03 ’04 ’05
$1.21
$1.51
$1.76
$2.07
$2.71
’06
$59,490
’06
$5,069
’06
$2,787
’06
$3.21
Diluted EPS
2006 Growth %: 18.5%
Five-year CAGR: 21.5%
2006 Capital
Expenditures
($3.9 billion)
•
New Stores
•
Remodels & Expansions
•
Information Technology,
Distribution & Other
61%
12%
27%
2006 Sales Mix
($57.9 billion)
•
Consumables & Commodities
•
Electronics, Entertainment,
Sporting Goods & Toys
•
Apparel & Accessories
•
Home Furnishings & Décor
•
Other
23%
19%
4%
32%
22%